

In this tutorial, we’ll build a practical MongoDB GUI using simple drag-and-drop components and basic JavaScript, in less than an hour. This is a tutorial that even less-technical builders can follow.
MongoDB is a source-available, NoSQL database program that uses JSON-like documents and optional schemas to store data. It’s a common database used across many industries, including enterprise tech companies, but due to its schemaless system, it’s a little less straightforward for non-technical users to query and use. In this tutorial, we will build a user-friendly, interactive dashboard that allows users to dig deep into data with useful charts and summary data.
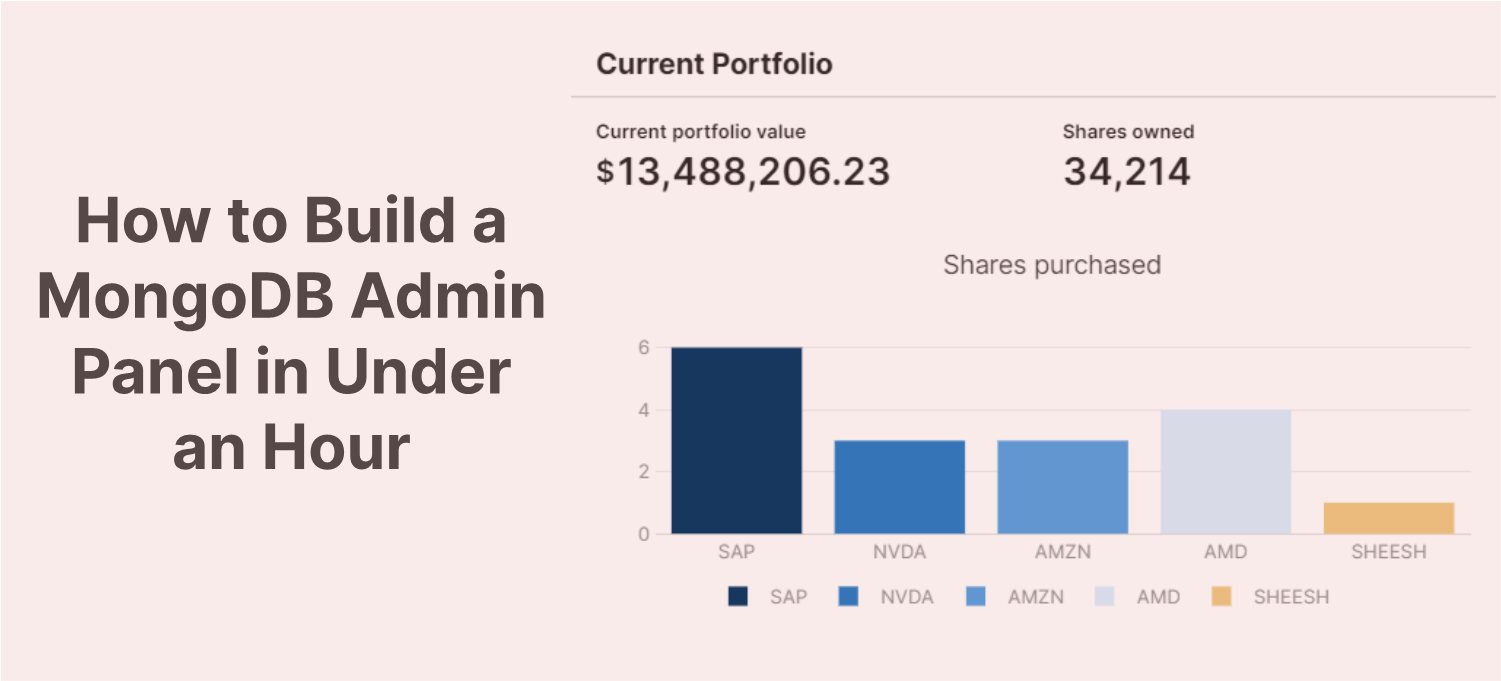
In our admin panel we’ve paired a MongoDB database with a custom GUI we created using Retool’s pre-built components. The table shows a centralized overview of all accounts and gives users the ability to click any row to see detailed analytics for that record, with a display of useful charts, tables and filters to present data.
This panel allows a non-technical user to manipulate complex data and read/write to the database. This dashboard is useful for many use cases, including back-office datasets, customer order analysis, and much more. Using a platform like Retool to build a custom GUI is a great way to build a bespoke dashboard if Compass or another front-end platform isn’t quite cutting it.
Let’s get started with the build!
First, to connect to your data, head over to the ‘Resources’ section of your Retool environment and click ‘Add new resource’ and ‘MongoDB’. Here you need to enter your credentials for your MongoDB account.
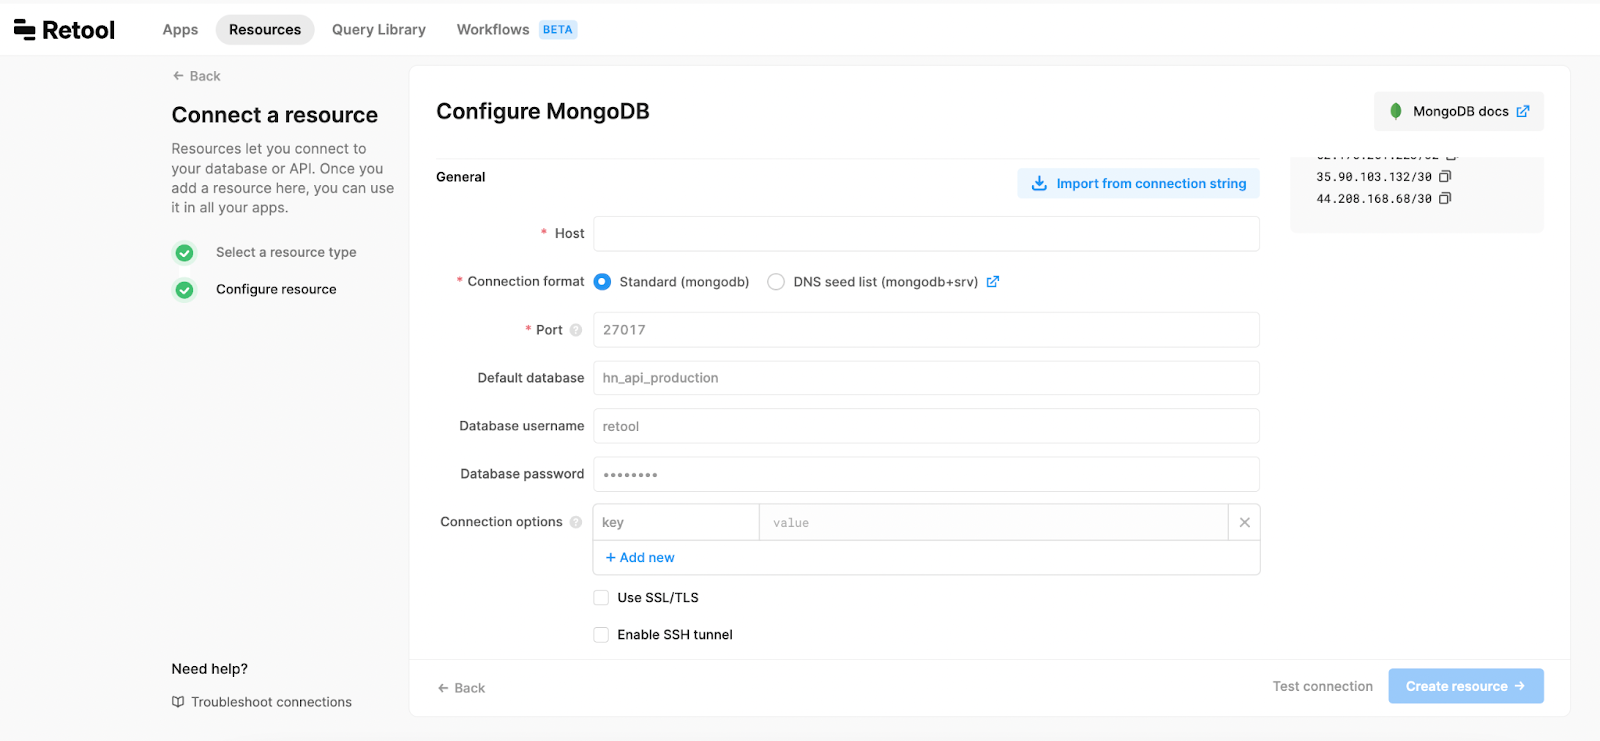
You can find more information about connecting to your database in the Retool MongoDB docs.
Now that we have connected to our MongoDB (or in our case, we’ll be using the demo data that Retool provides) we’ll add a query to pull our data into the frontend.
When you open Retool, you’ll see a blank canvas with an explorer panel on the left, an inspector panel for components on the right, and a resource panel on the bottom.
In this resource panel, click the plus sign to add a new query. Select the resource you set up.
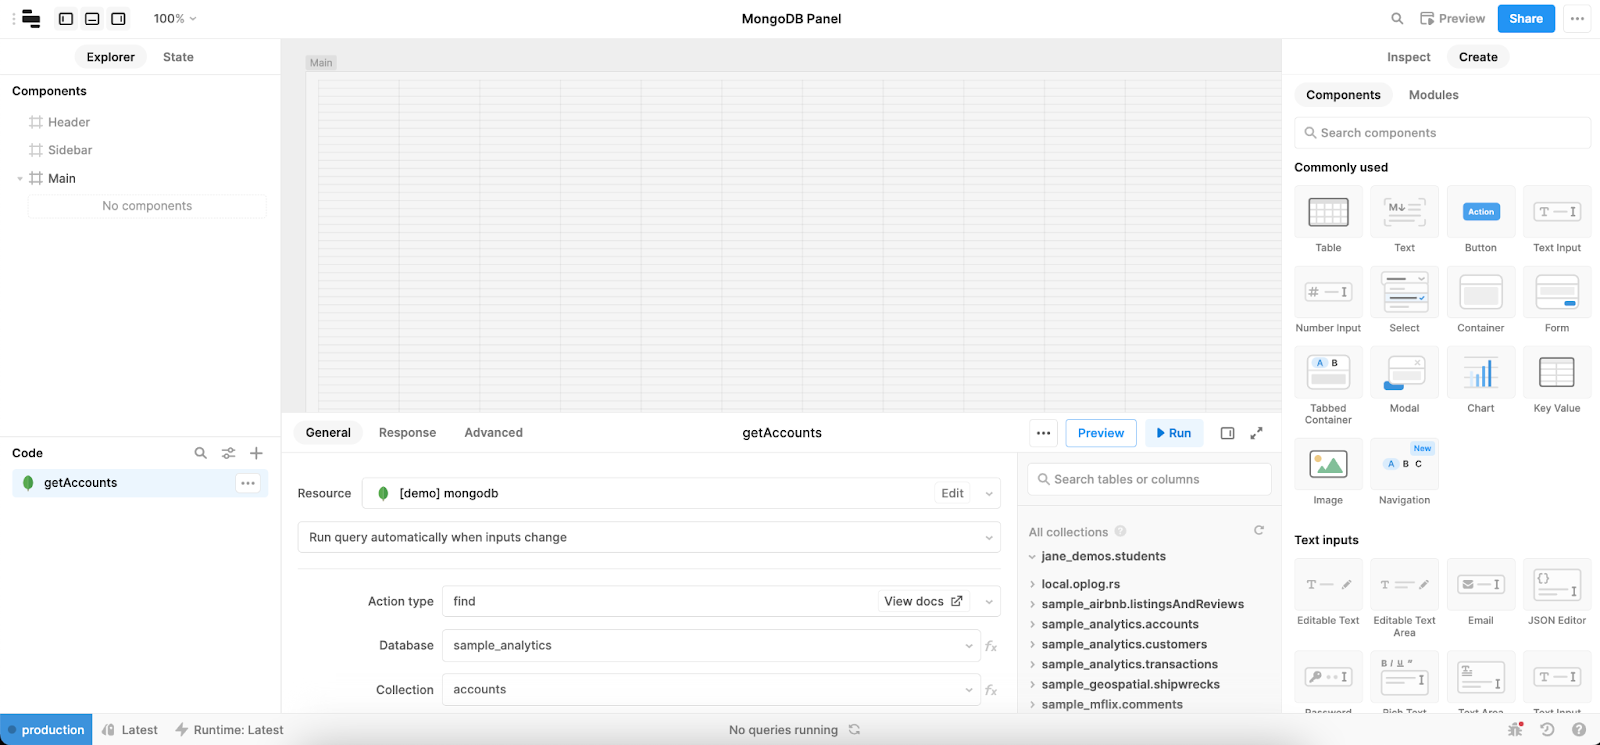
To read the data, we are using Action type find, to pull the accounts Collection from the sample_analytics Database. Usefully, as MongoDB is a native integration in Retool, they have already programmed many of the most common database commands in the Action Type dropdown, following the MongoDB querying pattern.
Name the query something useful like getAccounts and test it to make sure you have the right data. Once your query is up and running we can start connecting this data to our components.
First, we are going to pull in a tabbed container component, which will be our method for switching back and forth between our two main views. You can drag this onto the canvas from the right-hand panel, and adjust it to the full size of the ‘Main’ frame. Name the tabs according to the views so you can refer to them again later.
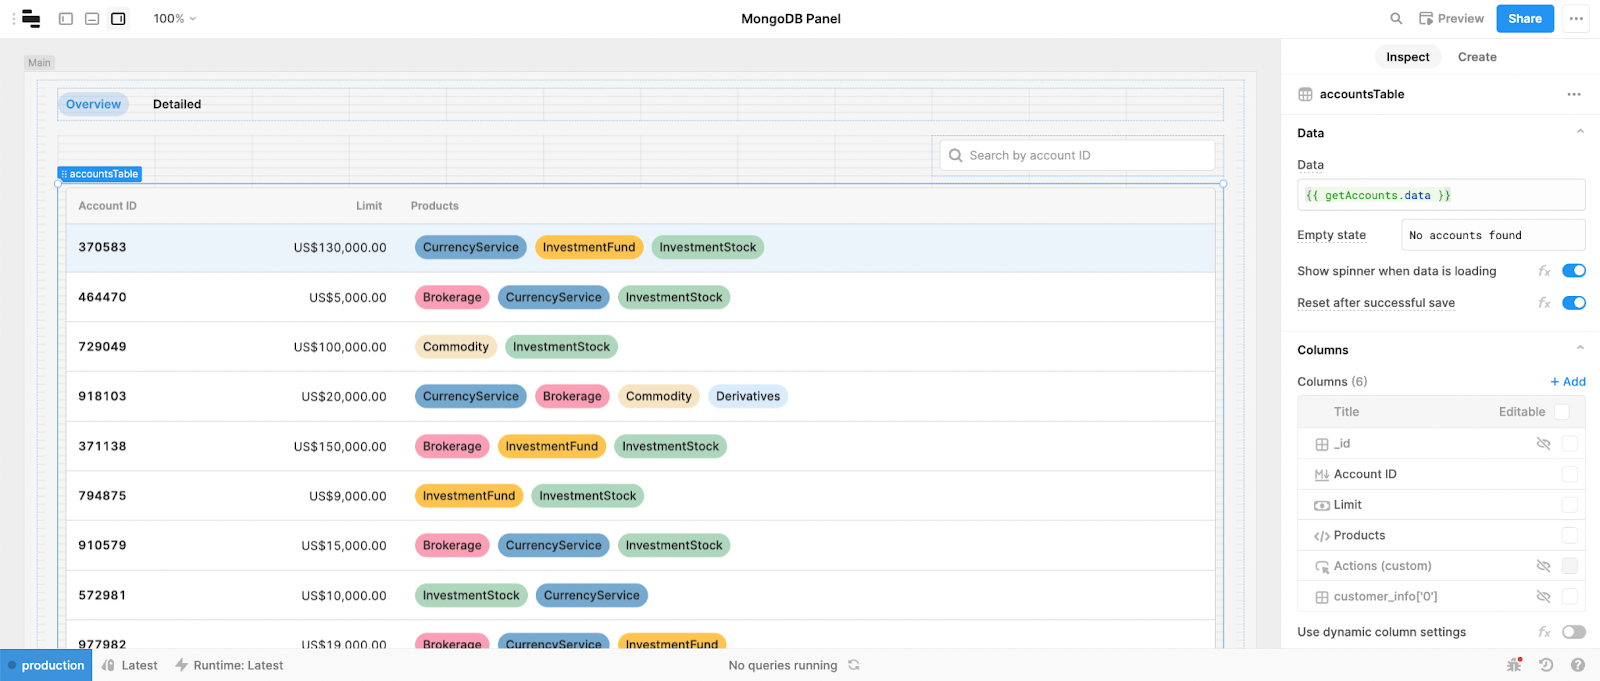
Let’s start by filling up the accounts View. Pull in a table component from the right-hand panel and drop it on the canvas. For this app layout we will adjust the table to be full-width.
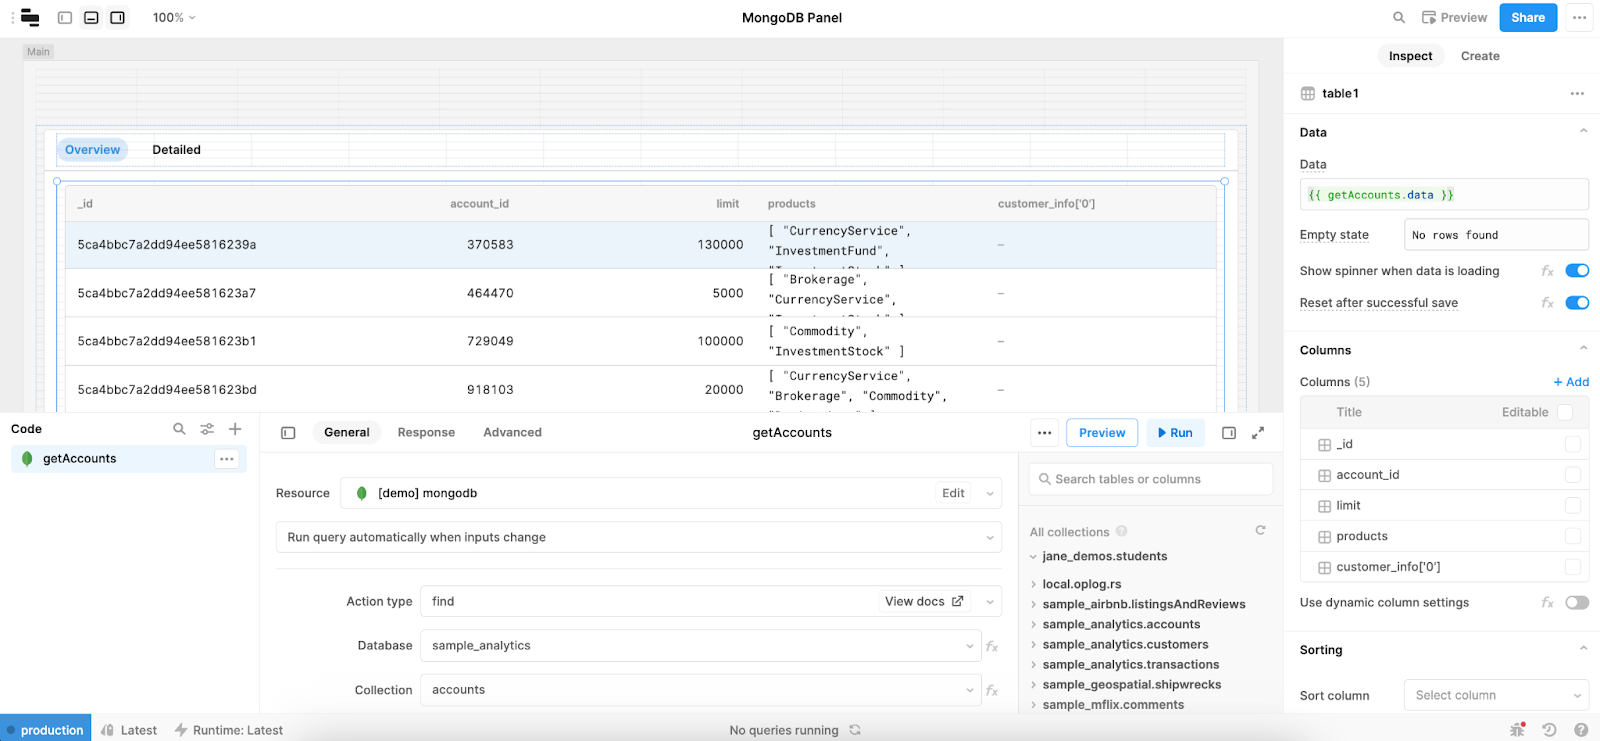
In the ‘data’ value of the table component, we are going to reference our getAccount query. For this we will use JavaScript escape hatches and the query name with its data attribute: {{getAccounts.data}} to pull in the full object. The table will automatically fill with the data.
Now that we can see our data in the table, let’s go in and clean things up a bit. You can edit the table’s functionality and presentation in the Inspect panel under ‘columns’. In our case we set the ‘Limit’ column type to be Currency with USD as the Currency code. We’ll also hide the _id column.
To hide the appearance of the tabbed container, you can also set the coloring to the ‘canvas’ color in the container settings.
In the next section we’ll explain how to turn the ‘Products’ array into colorful tags.
For this table, we actually wanted to include some colorful tags to show the different product types. Retool currently doesn’t offer a native multi-tag option, but thankfully it’s a very hackable platform, so we used JavaScript to create our own.
Under the hamburger menu in the top right of the Retool environment, you’ll see Scripts and Styles. Click here and add the following function under Javascript:
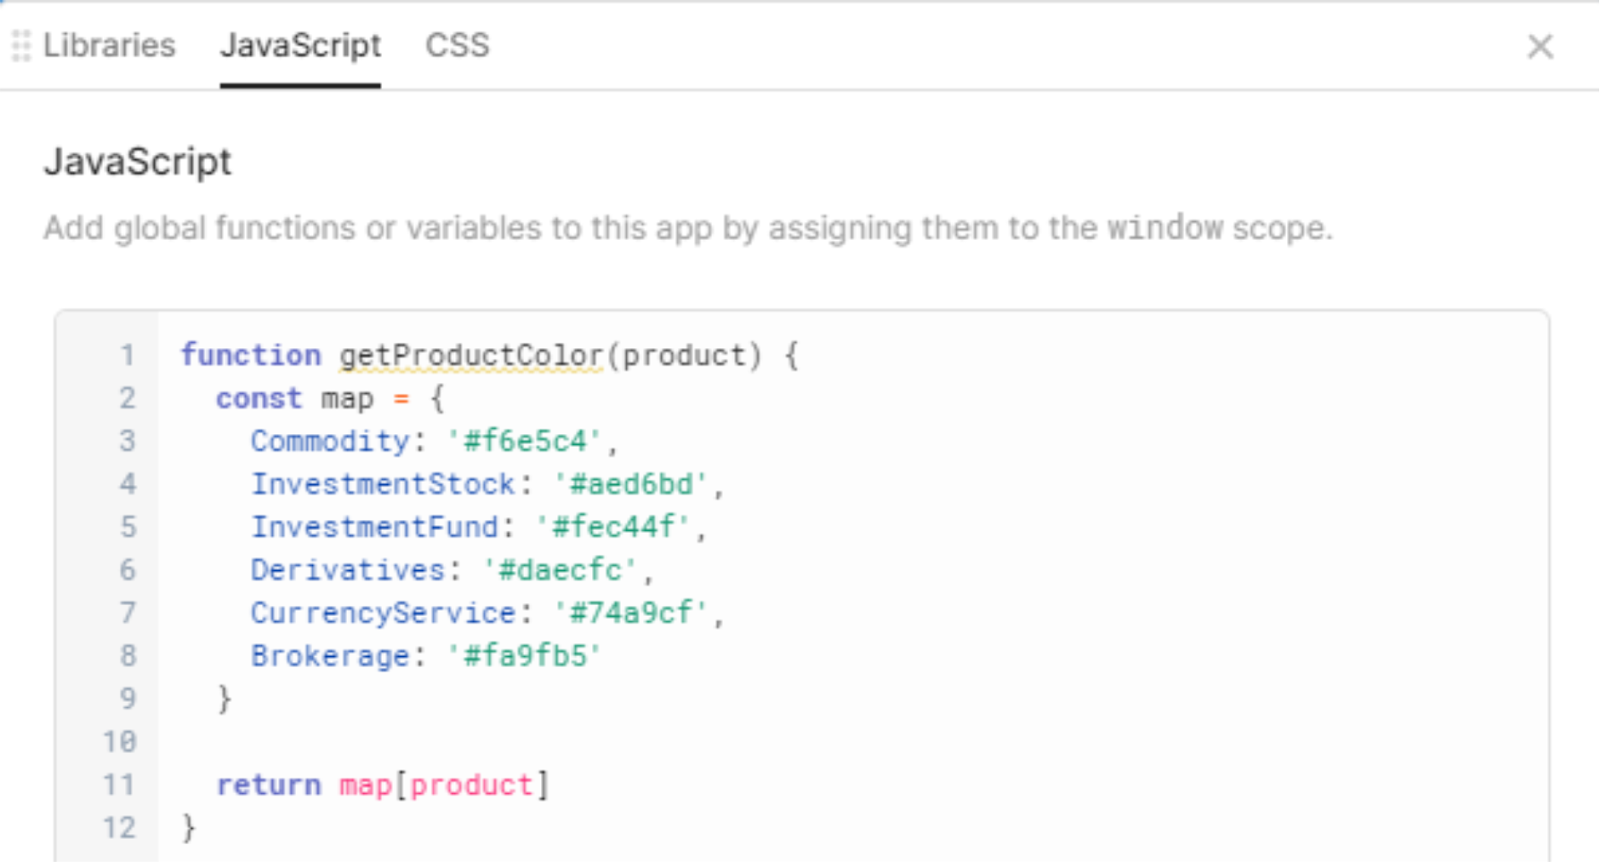
This function defines the colors of each tag using HEX codes.
Now we can change our Product column type to HTML and add the code below to ‘Mapped value’ to define the appearance of the tags. Under ‘background-color’ we will call the above function.
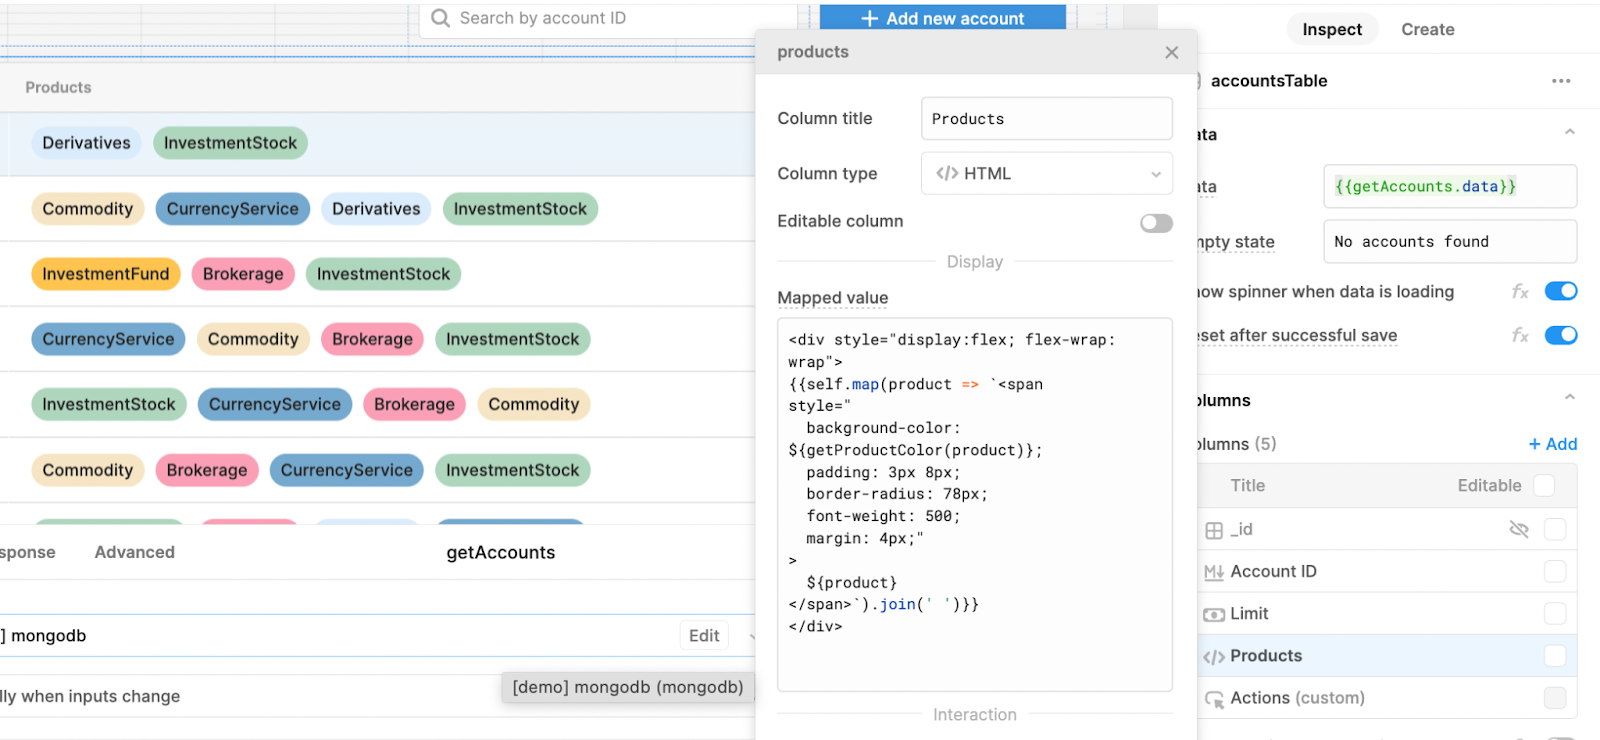
A quick hack for some great-looking tags!
Let’s add a search input so we can search for specific accounts in the table. We’ll do this using a Text Input component and we’ll call it accountSearchInput.
To filter the data, we'll go back to our getAccount query and add the following code to the Query field, our table will be searchable by account_id.
{ "account_id": {{ accountsSearchInput.value ? parseInt(accountsSearchInput.value) : {$exists: true} }} }
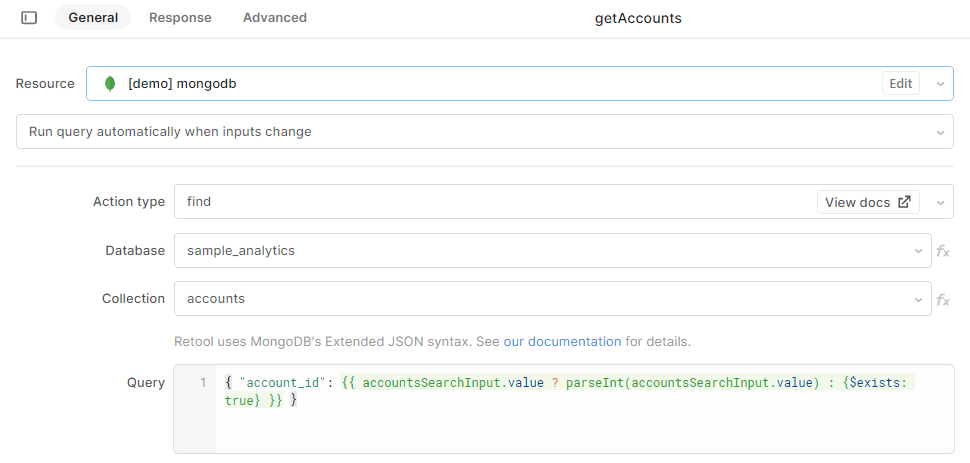
Here we have used a ternary to check whether there is a value in the input, and if so it parses the value as an integer (the input starts as a string) and filters the data for that specific ID.
At this point your app should look similar to this:
If you're looking to apply more filters to your table data, check out our Retool table filter tutorial.
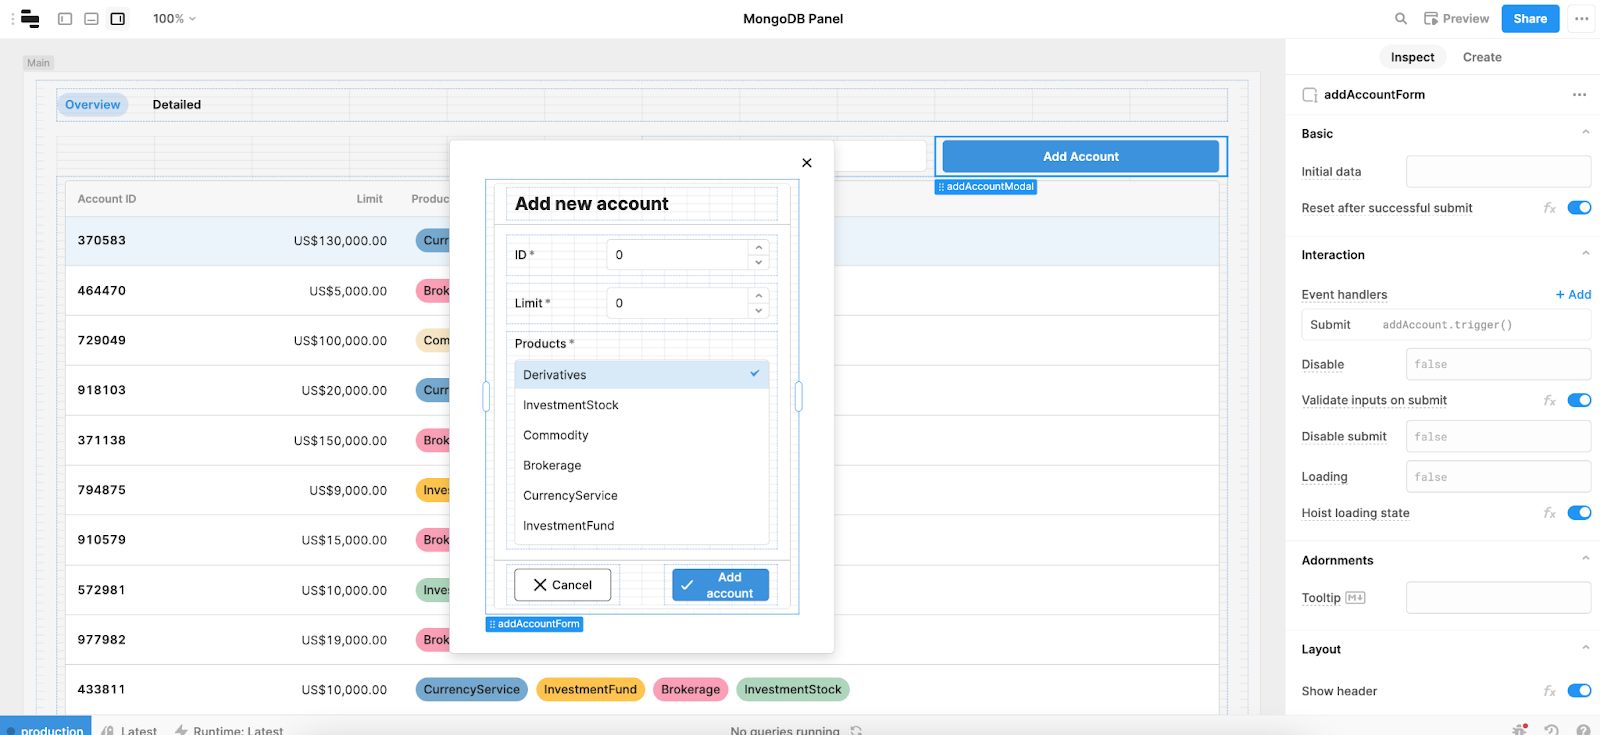
As with most admin panels, we need to add new accounts to our database. So let’s pull in a modal component beside our search bar and title it ‘Add new account’.
Now, we can add a form component for our input values, and drag those in from the right-hand panel too.
Retool makes creating forms really easy with their ‘auto-generate’ option, which allows you to generate the form based off the values in a table or your database schema. You can then adjust this manually.
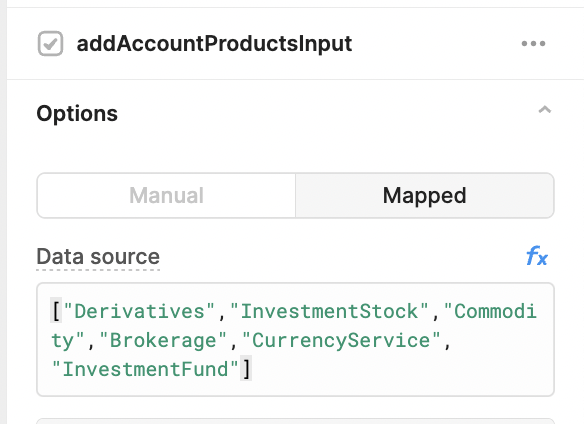
In this form, we used NumberInput components for ID and Limit, and a MultiselectListbox for products.
To set the listbox values we’ve used the Mapped option and added our product types as an array under fx.
To improve the UI, we also added a cancel button. This uses an Event Handler to close the modal when it’s clicked.
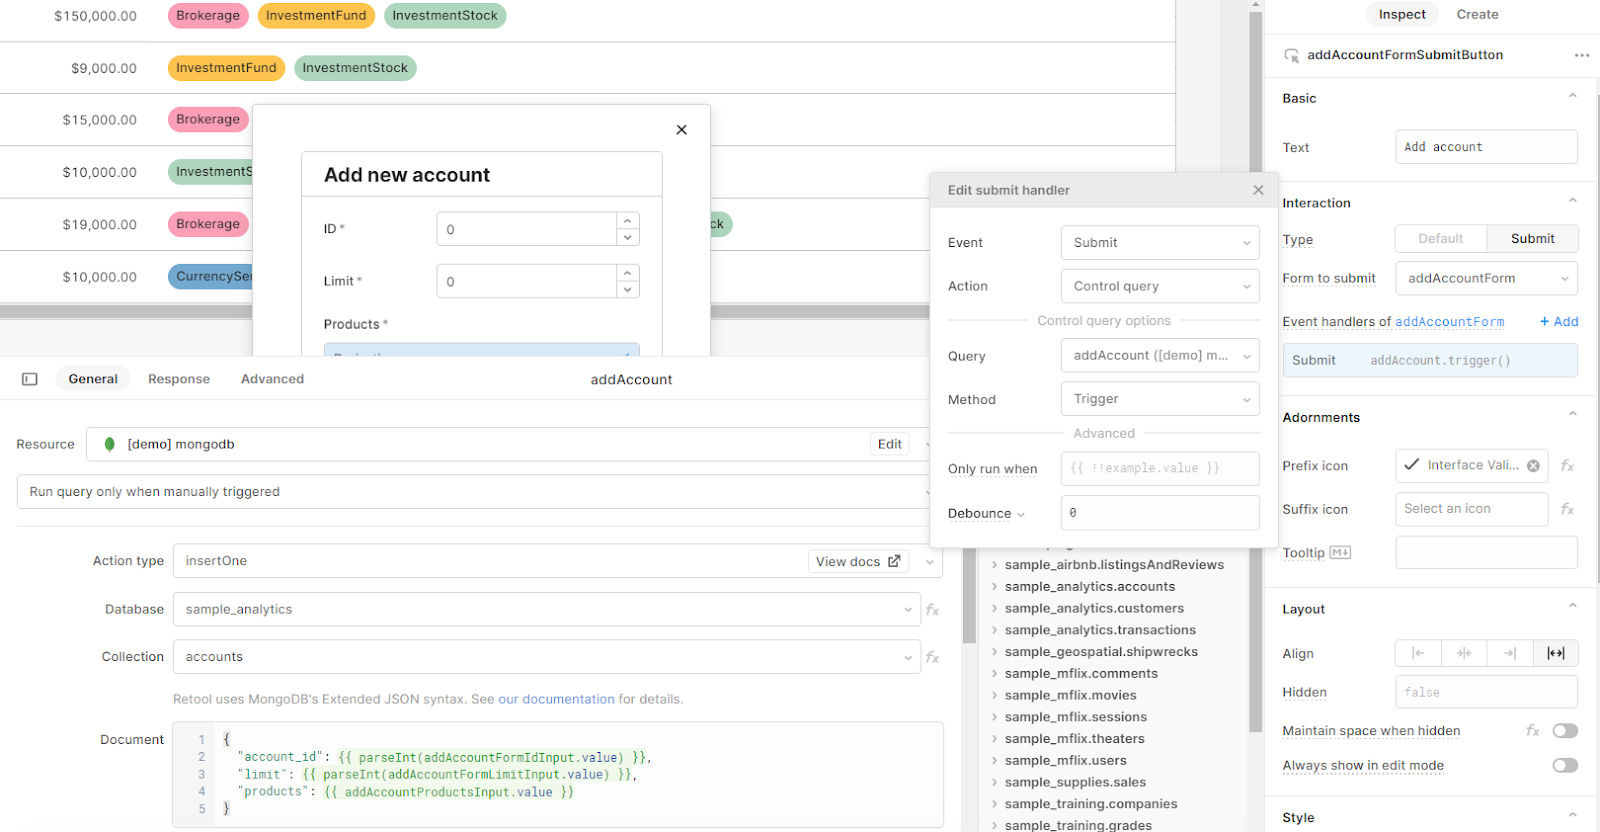
Now, we need to add a query which adds the data to our MongoDB.
In the bottom resource panel, add a new MongoDB query and set the Action type to ‘InsertOne’, linking it to the same database and collection.
In the Document value box of the query we’ll pass in the object that will be added to the database. We’ll use key:value pairs to declare the column headers alongside the corresponding names of the components in the form.
Now that we have our addAccount query, we can trigger it to fire when we click our Add Account button using an event handler.
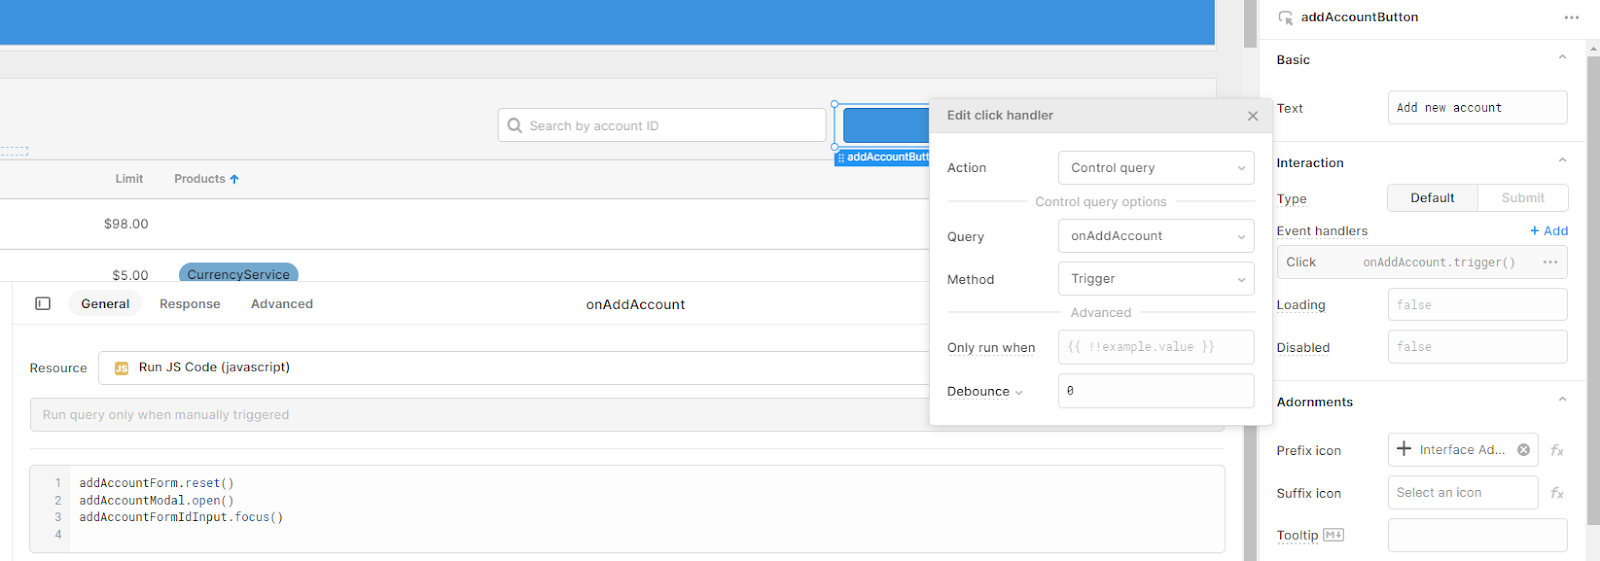
To improve our UI, we also want to reset the form when it is opened again. You can set the event handlers using the Retool UI in the components panel, but as we want to trigger three actions simultaneously, we have written them in a single JS Script which will be triggered on the form button click.
This query will reset the addAccountForm, open the addAccountModal and focus on the first component in the form (addAccountFormIdInput).
You can learn more about form UI best practices in our form UX/UI guide.
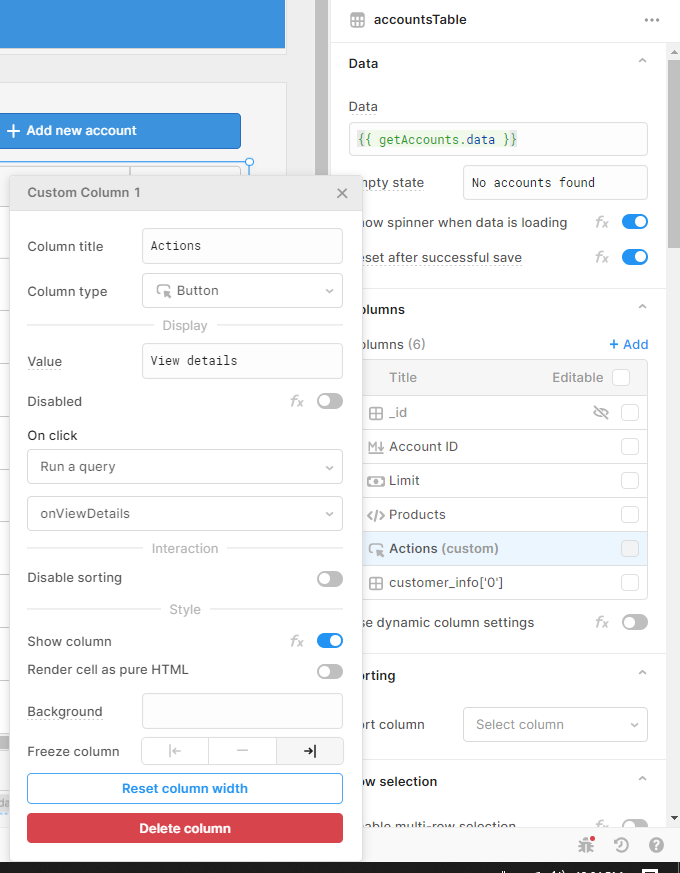
This view of the app is now fairly well rounded out with the necessary functionality. The last thing we need to do here is to add a button to access our second view (accountDetails), that will show us the details of a selected account.
To do this, open the table components settings and add a Custom column. Change the column type to Button with a value of View details. To trigger the tabbed container to switch view, we’ll add another JavaScript query called onViewDetails with this bit of code that triggers the tabs to switch:
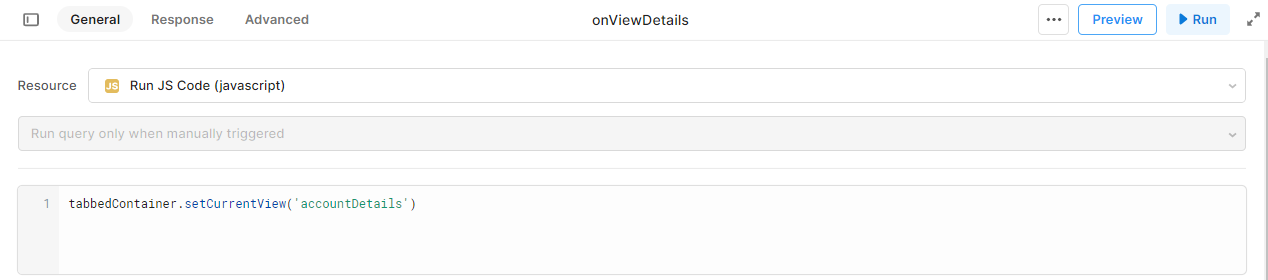
tabbedContainer.setCurrentView('accountDetails')
Let’s head over to our second view and start building out functionality.
Our second view is going to show a more detailed view of the record clicked in the overview table, with charts and statistics as well as more specific data about transactions.
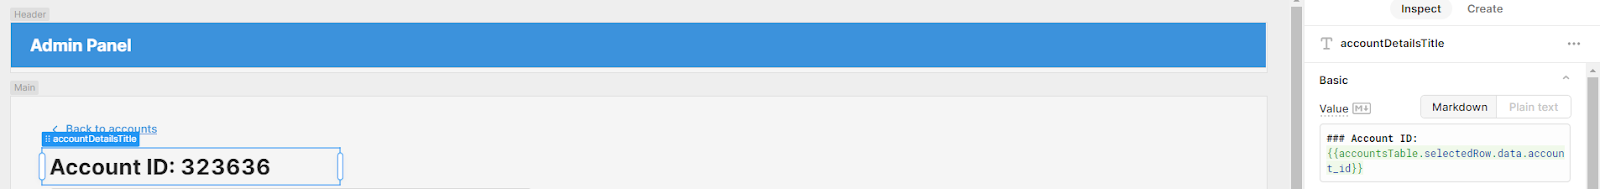
First things first, we want to make sure it’s clear which account we are looking at, so we’ll add a text component using markdown with the value ### Account ID: {{accountsTable.selectedRow.data.account_id}}. This pulls the account ID we just clicked from the ‘selectedRow’ of the previous table, and sets the styling to be a header.
The next thing to do here is add another query (getTransactions) that will pull the additional data we want to display for this view. In our demo set this would be the transactions Collection.
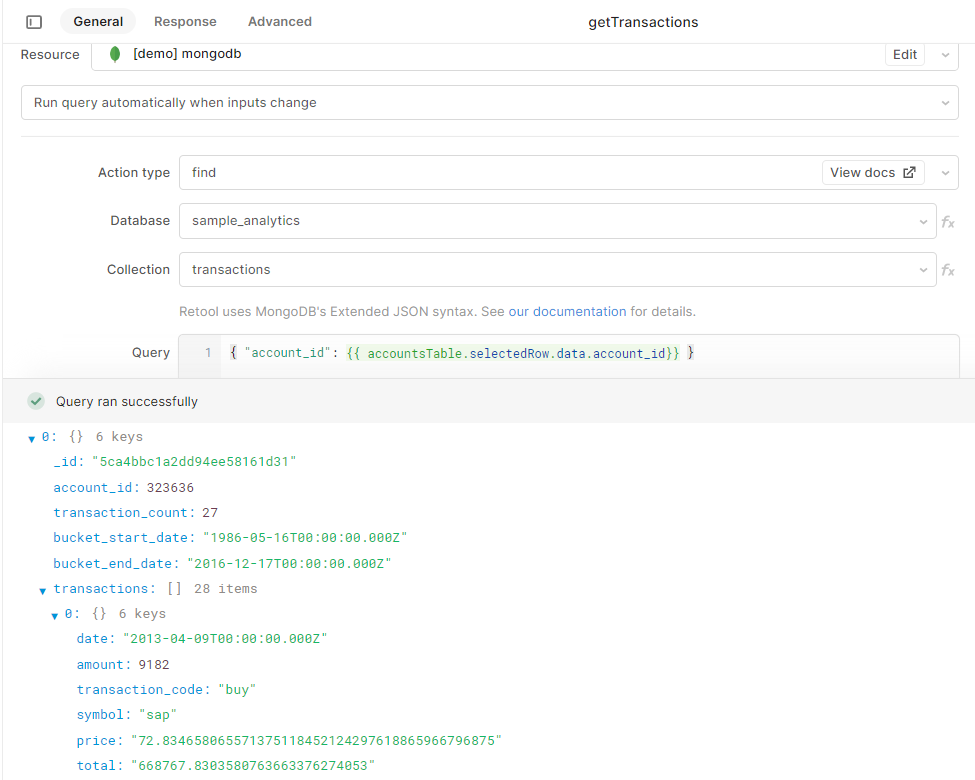
To filter the transactions to only show the account we clicked in the table, we’ve queried by the account_id of the selected row from the overview table.
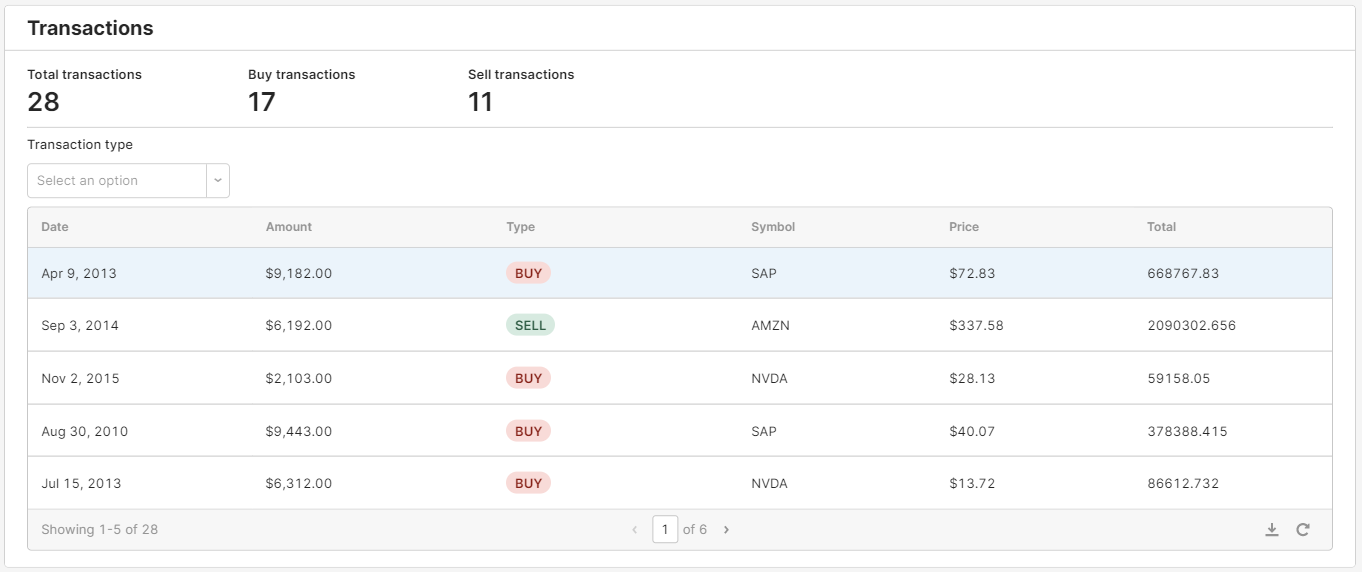
Let’s add a container, titled Transactions, that will display information about ALL transactions, and allow us to filter by transaction type.
In this container, we’ll add a table (connected to the getTransactions.data query) and some Statistics components.
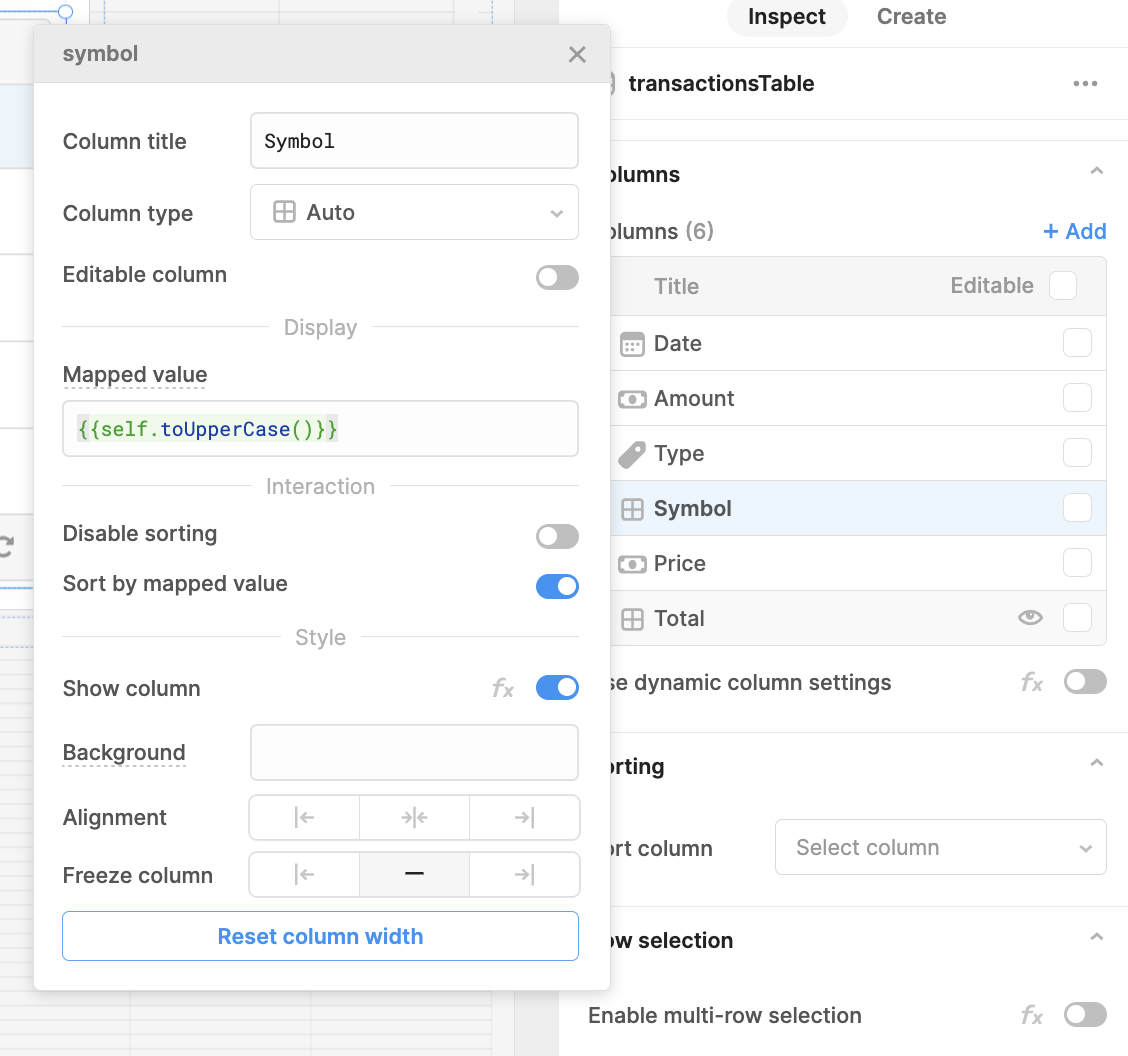
Like we did before, you can use the Retool UI to quickly tidy up the table by selecting the corresponding data types for each column to present the data clearly.
For the ‘type’ column, we used the tags data type to add a clear visual aid to reading the data. If the data is untidy you can also use JS functions to alter them in the frontend. In our case the ‘Symbol’ values were all in lowercase, so we added the code: {{self.toUpperCase()}} in the ‘mapped value’ box.
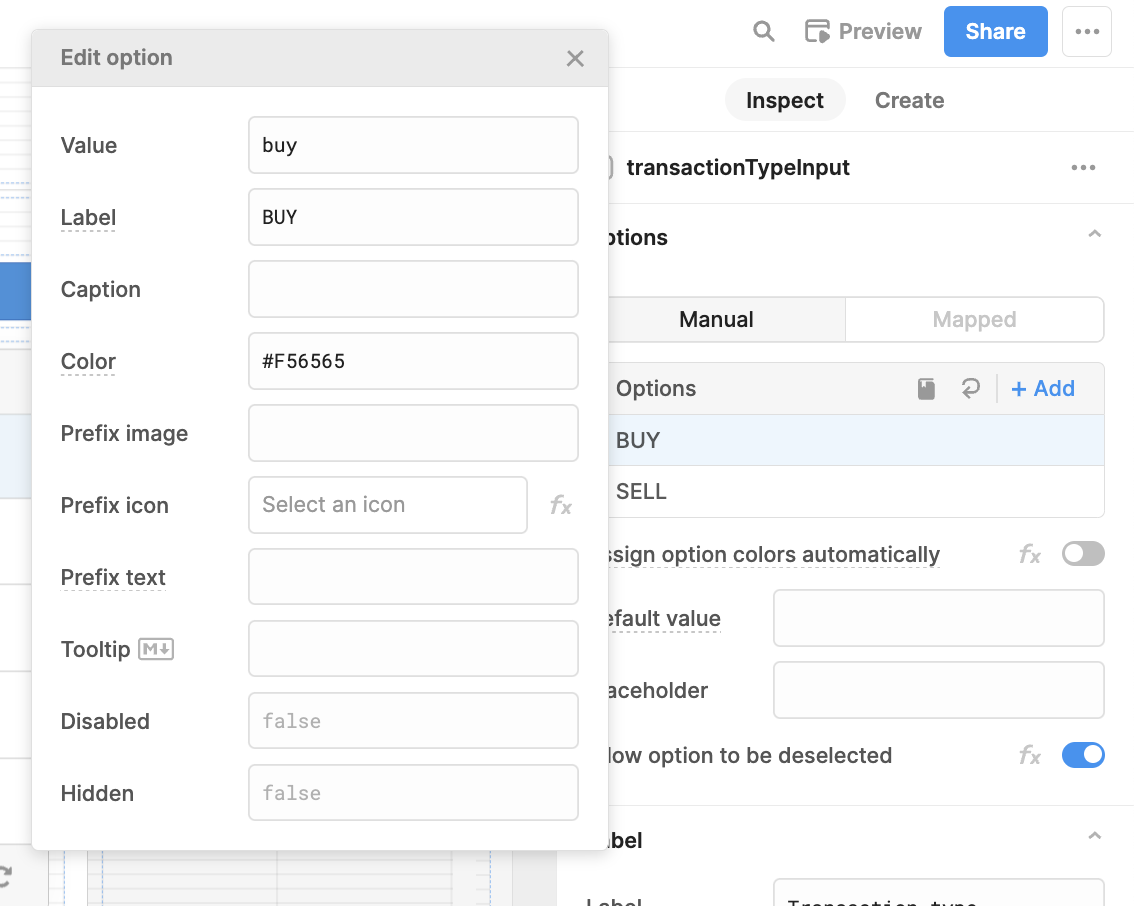
Our final step with this table is to add a Select component above the table to filter based on transaction type.
For the Select component, you can either manually input the dropdown options, or map them directly from unique values in your database. As we only have two options: BUY and SELL, we chose to input them manually. We also set the colors under the ‘Edit’ section of each option.
To make sure the table data is filtered, we need to go back to our table’s ‘Data’ value and change the code to be:
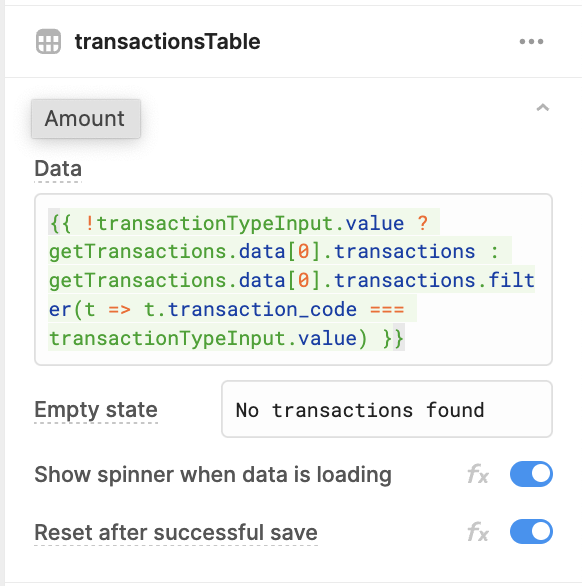
{{ !transactionTypeInput.value ? getTransactions.data[0].transactions : getTransactions.data[0].transactions.filter(t => t.transaction_code === transactionTypeInput.value) }}
This ternary checks for an input value in the Select component, and filters by the value if it exists.
Now that we have our table, we need to add some charts and statistics to illustrate our data clearly.
Above our table we’ll add some Statistic components which count the transactions. To calculate these, we have used the .length attribute of our data, filtering where necessary. This is what our code looks like to return that data:
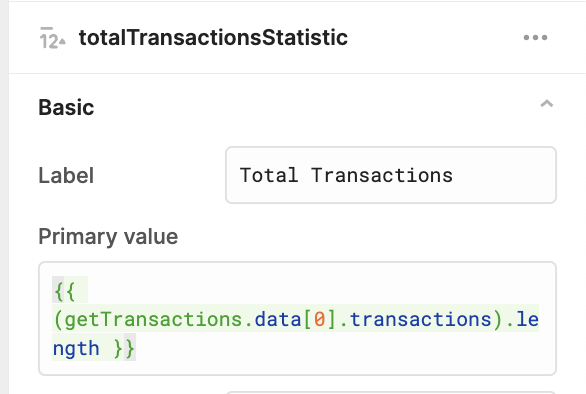
Total transactions value:
{{ (getTransactions.data[0].transactions).length }}
Buy transactions value:
{{ (getTransactions.data[0].transactions.filter(t => t.transaction_code === 'buy')).length }}
Sell transactions value:
{{ (getTransactions.data[0].transactions.filter(t => t.transaction_code === 'sell')).length }}
We also added some more containers with overview stats of each portfolio and their account history. These stats use scripts that perform complex arithmetic in the frontend, and you can use JavaScript to perform these calculations based on data.
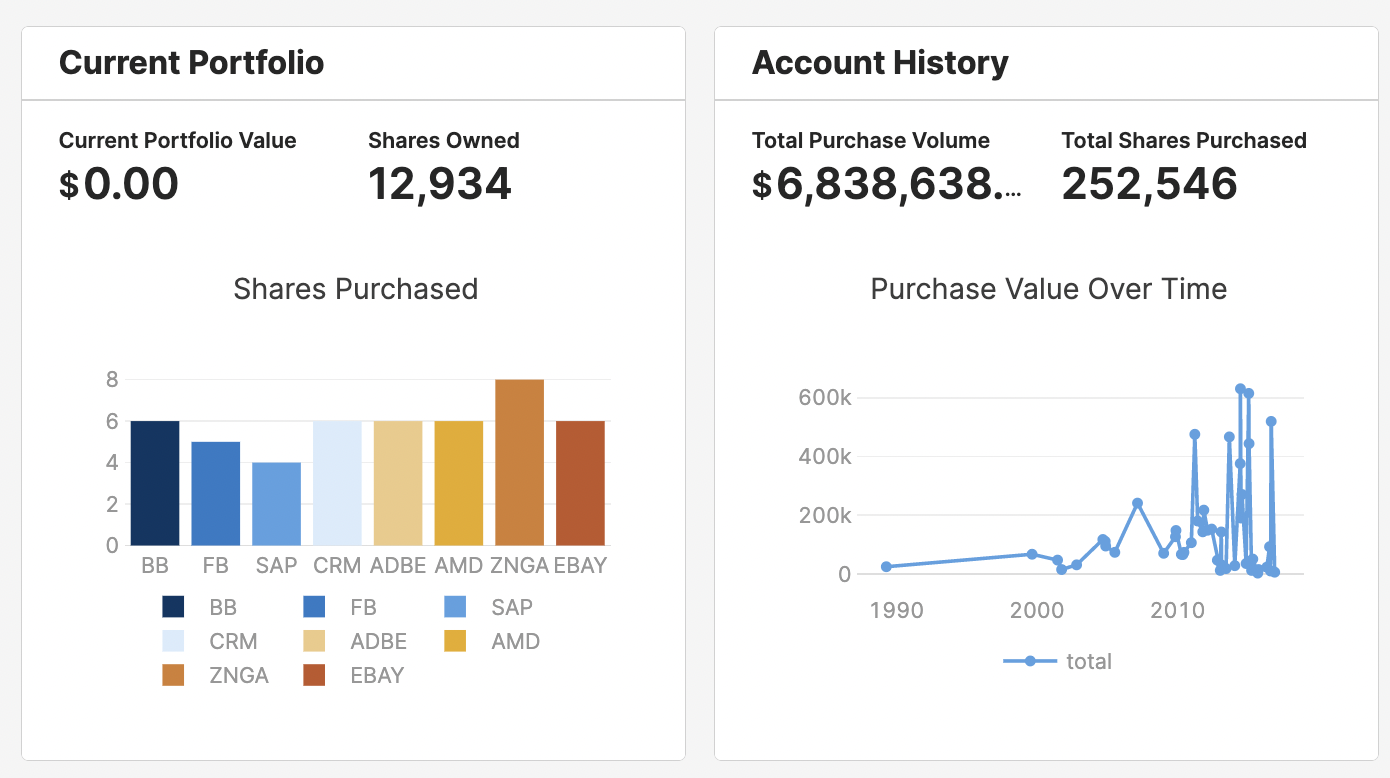
Now let’s have a look at how we connected the charts. For these we used a chart component.
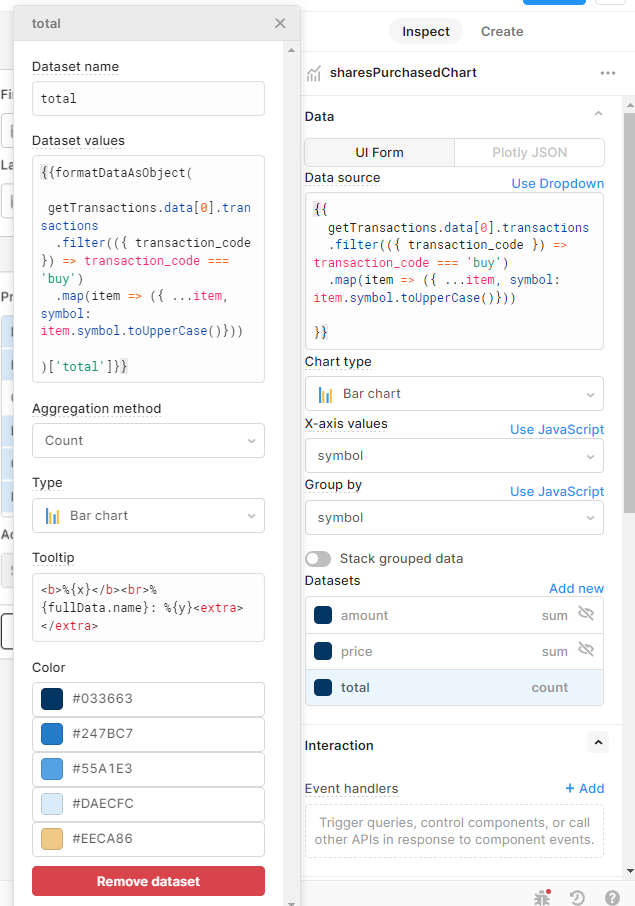
To set up this chart we have used a bar chart type. Retool’s chart UI form takes data as an object. We used the FormatDataAsObject to do this within the component itself, and have mapped the data to filter the transactions data for those with the code ‘Buy’ and returning the company symbol.
We’ve then grouped the data by this company symbol in the UI, and set the dataset and aggregation to ‘count’ the number of transactions for each.
You can read more about using charts in Retool in our Plotly Charts tutorial.
So now that we can see the Current data on that account, let’s also create a container showing some time-based data.
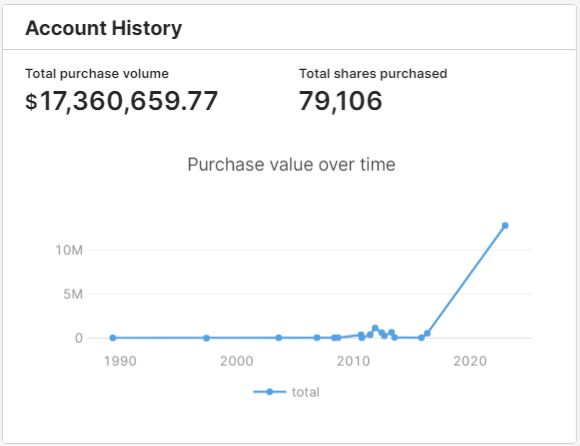
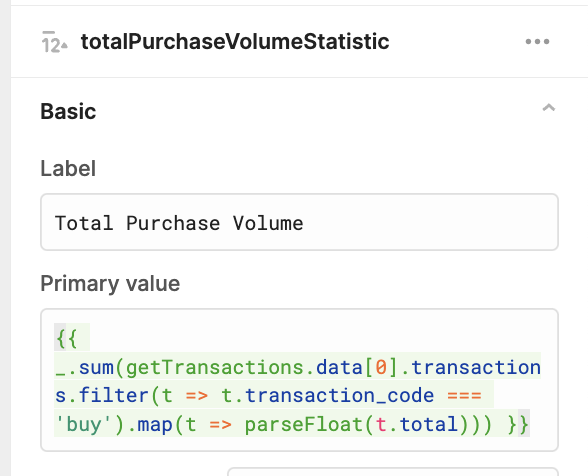
In this container, we set the statistics to sum the ‘Buy’ transactions using the Lodash _.sum function.
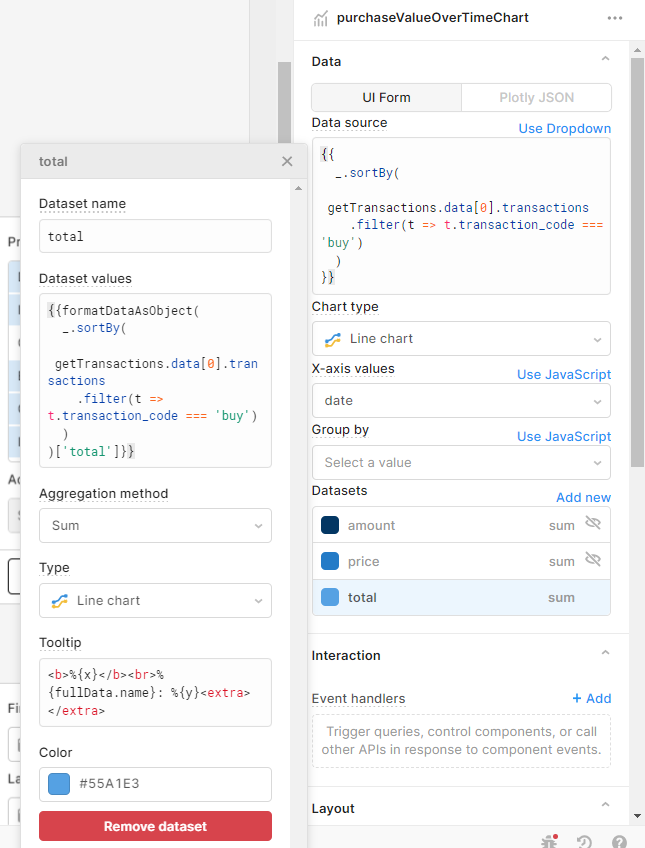
To present this data in a chart, we’ve chosen Line chart instead of bar. We set the datasource to filter the transactions with the ‘Buy’ transaction code and set the X values as the date, and the dataset as ‘Total’.
To polish off this app, let’s go through some final UI touches to improve user-friendliness and functionality.
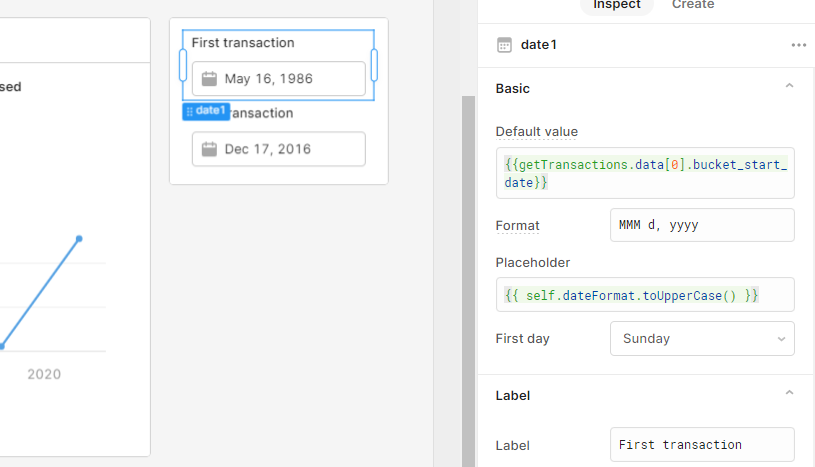
To make the data clear and easier to read, we’ve added a container to show the time period in which transactions took place. The default values are set to the start date of the transaction button, and the last transaction to the end date.
We’ve also added a simple form on the right side to update details for the company without leaving the page.
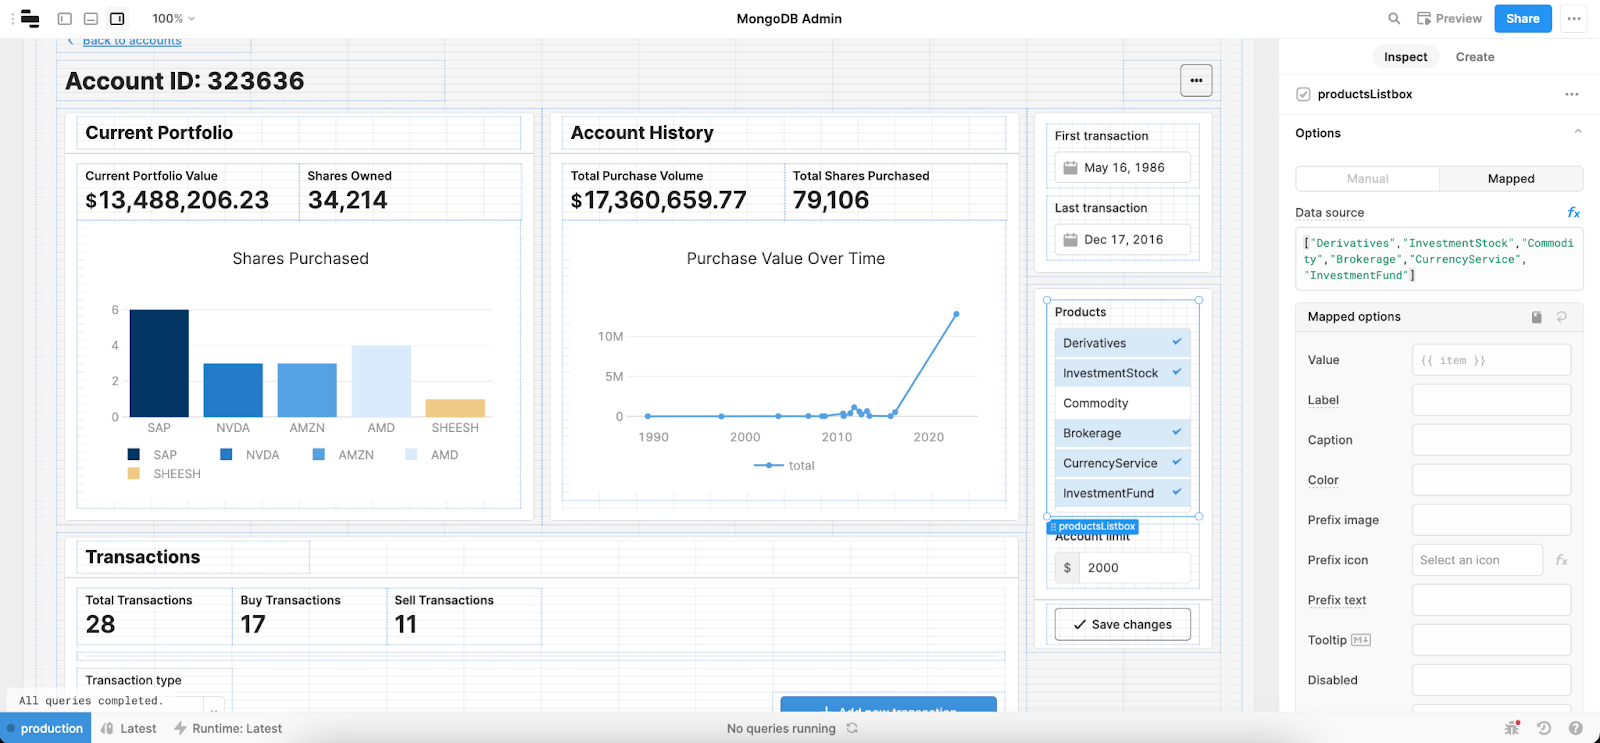
Again, we used a Multiselect Listbox, with the same properties as the first form we built. This time, we added a Default value of {{ accountsTable.selectedRow.data.products }} so that the Products already associated with the chosen account are pre-selected.
The second component is a number input that pulls its default value from the limit of the selected account: {{ accountsTable.selectedRow.data.limit }}.
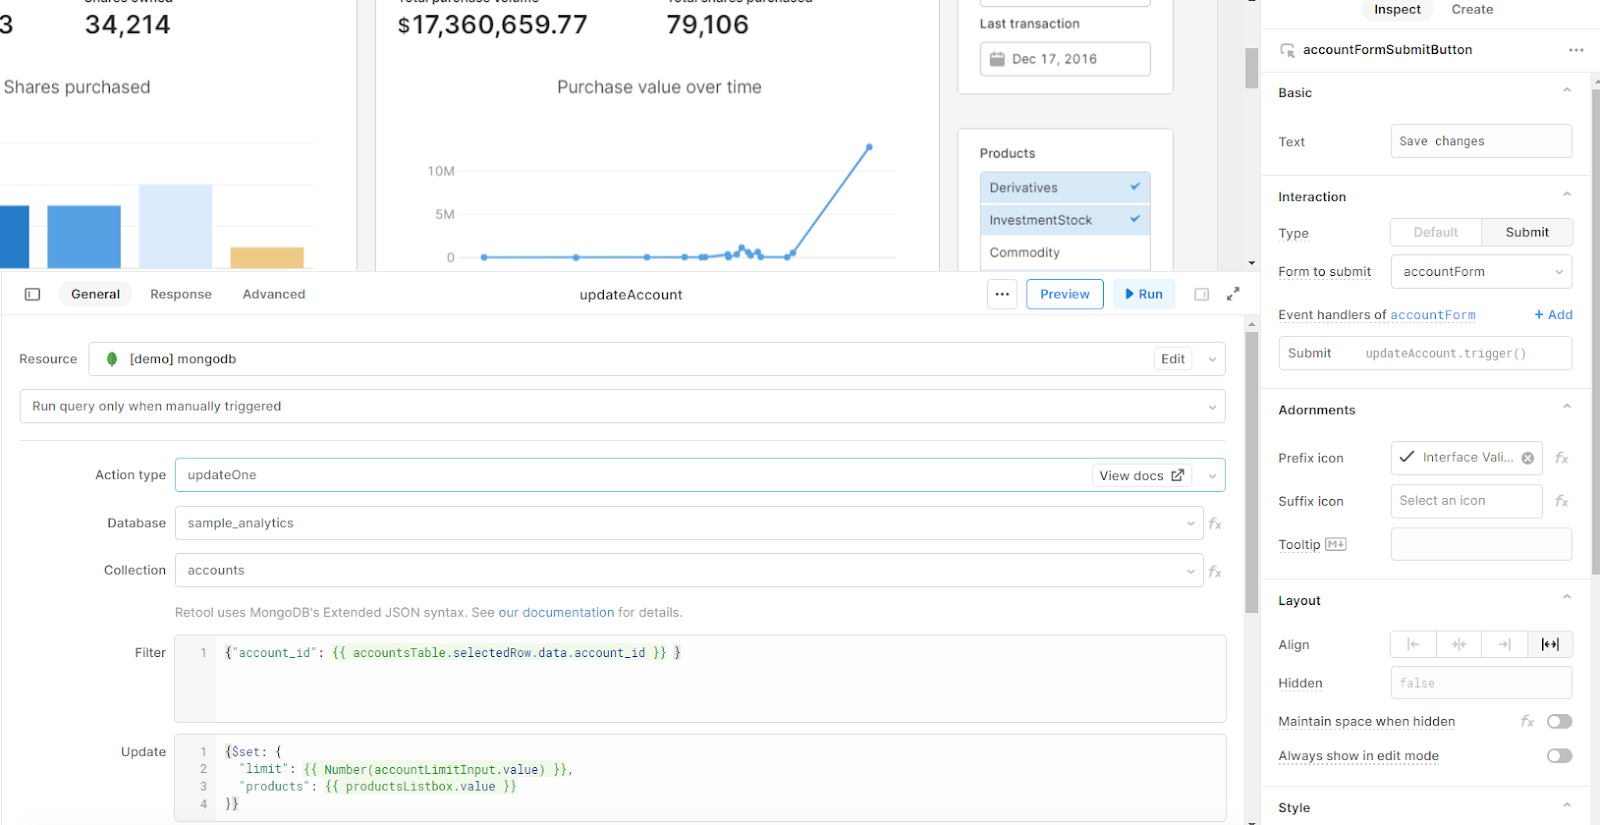
To finish the form, we need another resource query, called updateAccount, to be triggered when we click the form submit button. For this query, we set the action to UpdateOne, the filter to the selected account ID and the update as the key:value pairs of our ‘products’ and ‘limit’ data.
Then add an event handler to the ‘Save changes’ button to trigger this query on submit, as you can see in the right panel.
Finally, we need to add some return navigation so that the user can switch back to the overview page. We used a link component on the detailed page view and set the value to Back to accounts.
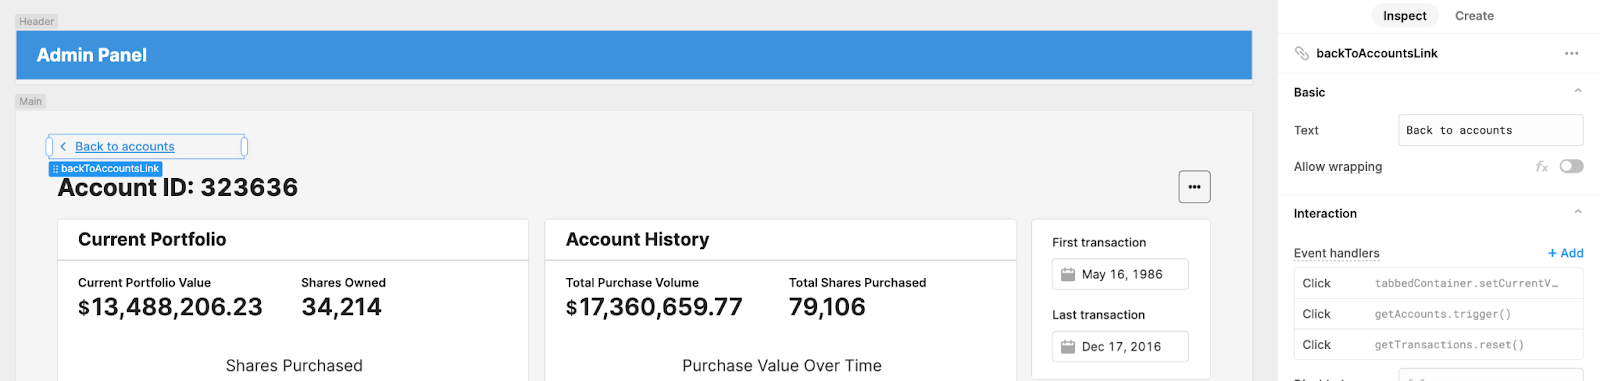
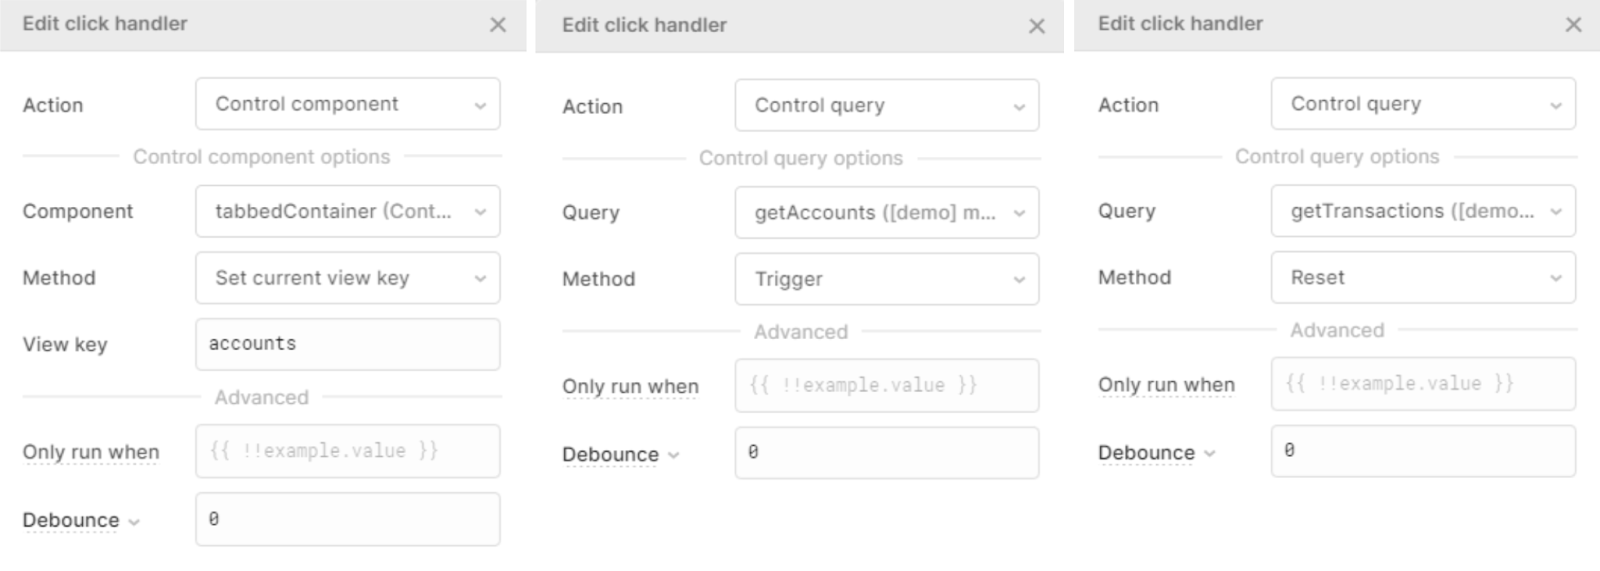
To control navigation from this view, we added three event handlers that will
1) take you back to the accounts view
2) run your getAccounts query to refresh the data and
3) reset the getTransactions query.
As our tabbed container switches views based on the selected row, we also don’t want to show the tabbed container buttons, so we have set these to hidden.
If your app features particularly heavy queries, or you find its performance slowing, we recommend opting for a multi-page app over the tabbed container system. You can find out more about best practices in our guide to multi-page apps in Retool.
For some final aesthetic touches, we have made use of the header frame to clearly label our app’s title and use some company branding colors.
So now we have a super user-friendly, fully functional app that allows for viewing and filtering of account information, the ability to view detailed stats and analytics for any account record and the functionality to add and update accounts and transactions!
----
Are you tired of forcing pre-built SaaS products to fit your internal tool needs? Looking for a custom dashboard for your MongoDB, PostgreSQL or other databases? At Bold Tech, we build bespoke internal tools that help your business grow. And we build them fast. Get in touch today to set up a consultation with our internal tool experts.

Bold Tech helped us tremendously on a recent app development project by providing expert Retool resources who could plug into our project and make an immediate impact. I highly recommend Joey and Bold Tech as the go-to Retool resource.

Bold Tech was an exceptional resource in helping us implement Retool for our organization’s compensation planning process. Bold Tech was available to troubleshoot and resolve issues at a moment’s notice, which was very comforting during a highly stressful and busy time for our organization. The Bold Tech team were a pleasure to work with and I sincerely hope I get the opportunity to collaborate with them again in the future!

We build internal tools, fast.


