.jpeg)
Hybiscus is a brand-spanking-new cloud-based API service that allows users to generate PDF reports with straight-forward data visualisation components. The service just hit #1 on Product Hunt only a couple of months ago, so we’re looking at an incredible new piece of software that we can easily hook up to Retool. While there are many ways to skin PDF-cat in Retool (some of which Kelly talks about in our PDF tutorial), PDF layout is still pretty limited and lacks the ability to visualize one of the most important parts of your app: data.
In sum, Hybiscus and Retool are an absolute dream team, providing beautiful and dynamic PDF reports in a matter of minutes. In this tutorial, I’ll walk through how to sign up for Hybiscus, set up a Hybiscus Resource in Retool, connect it to an application and get started making some stunning, automated reports.
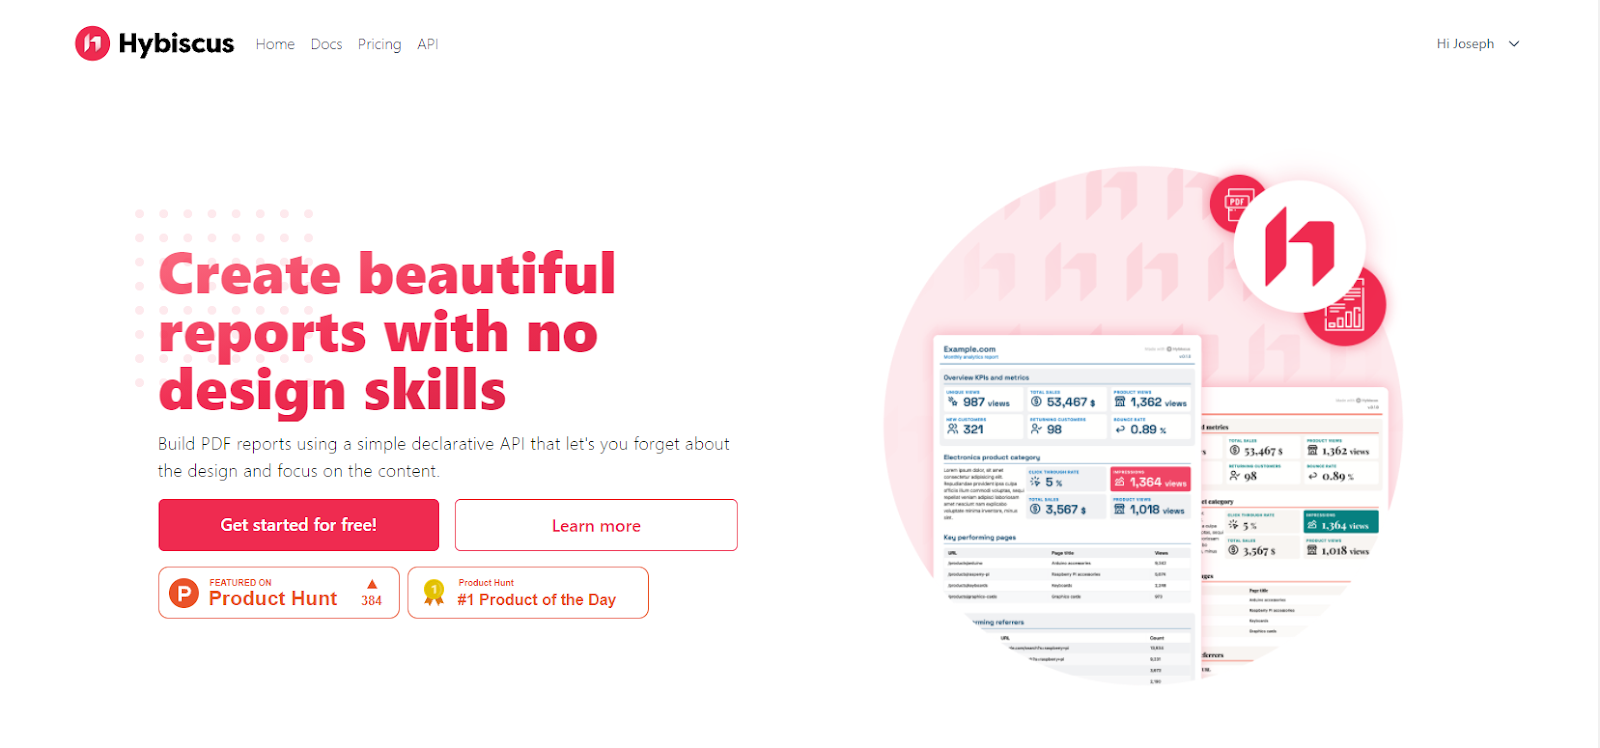
Head over to hybiscus.dev, click the “Get Started for Free!” button and create yourself an account. Hybiscus offers three billing plans at super low rates: Free (100 reports per month and some customizability), Start-Up (£7) and Enterprise (£14).
We will just be using Free for now, but if you are looking for multi page reports, better customization or more than 100 reports per month, you might want to consider upgrading.
After you’ve created your account, navigate to the “API Keys'' section of the Hybiscus site and click “Create New API Key”. I called mine “Retool PDFS”. Copy your API key and head over to your Retool environment’s resource section. In the list of available resources, click “REST API”.
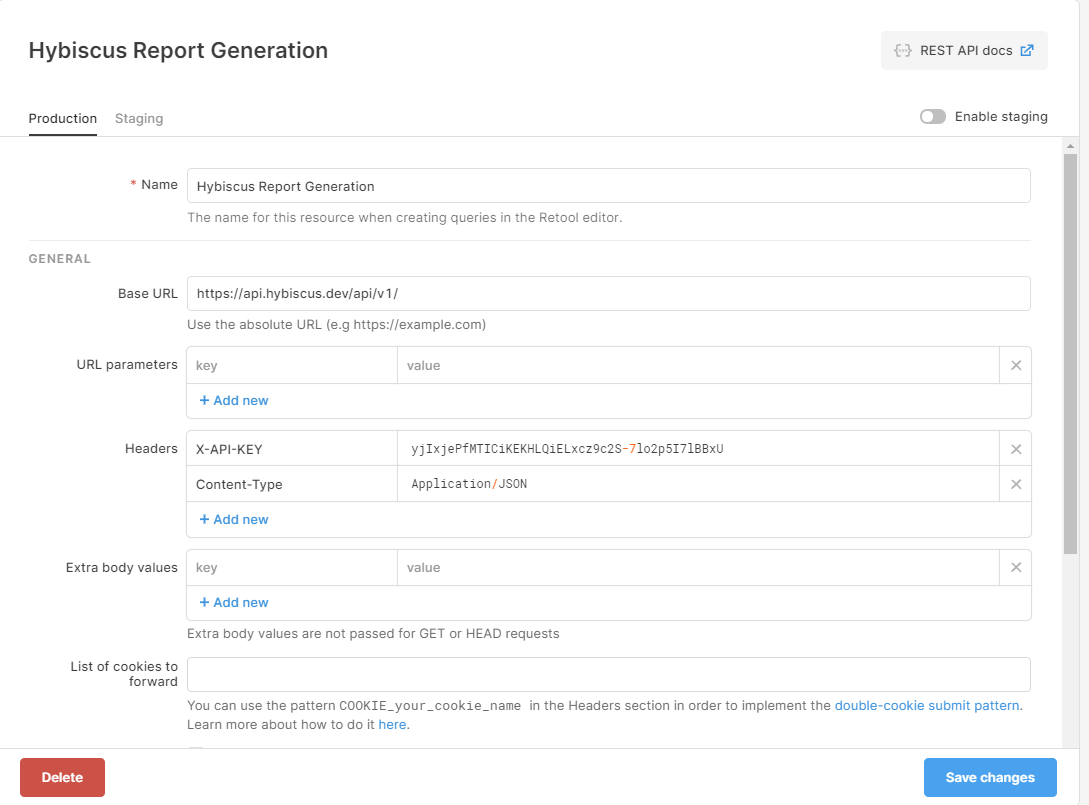
Here we are going to fill in information about our Hybiscus resource. If you are already familiar with how to set up a rest API resource in Retool and would prefer to just read the docs, you can follow their API documentation, or keep following if you want a detailed run-through.
Give your resource a name (I called mine Hybiscus Report Generation) and enter the Hybiscus Base URL: https://api.hybiscus.dev/api/v1/.
Next we are going to fill out our headers. Our first key is X-API-KEY and for the value, paste the API key that you copied just before. We are also going to add our Content Type here as our second header: the key here should be Content-Type, and the value should be ‘Application/JSON’.
Great! Click “Save Changes'' and, as simple as that, we are all good to go.
Your Resource should look something like this:
Now that your resource is ready to be used in your Retool app, you can start creating our first report.
For this tutorial, I created a dummy application with some example data from a company that sells products all around the world, and wants to see a breakdown of sales per region.
As you can see above, the app has a table that can be filtered to specific regions as well as a chart that shows the units sold according to these regions.
Both the chart and the table component are directly connected to a Query JSON with SQL Filter, which filters the data by region according to the region dropdown, so that when a region is selected by the user, the chart shows the data visually and the table shows a breakdown of values.
For this app, I’ve also added a “Group By” dropdown. Since our data set has a couple more pertinent attributes other than Country, Region and Units Sold (in this case item type, sales channel, and total_profit), the “Group By” dropdown selector allows the user to dynamically change the grouping of data presented.
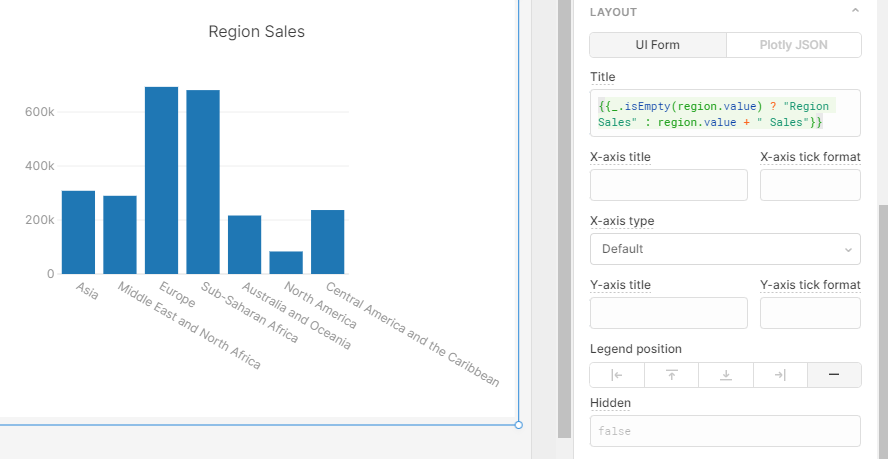
Our chart’s values look something like this:
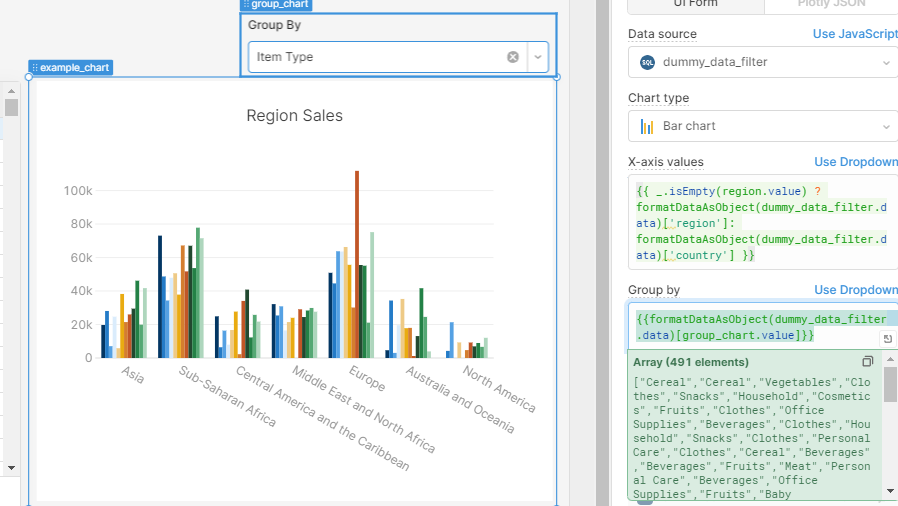
In the X-axis values box of the chart component, we used a ternary to switch between two columns in the data: when regions are selected by the dropdown it will drill down and show countries, and group this data by region when the region dropdown is not in use.
Then, the ‘Group by’ value is determined by our ‘group_chart’ dropdown selection. You can see this table and chart in action here.
Now that we have our Retool application set up, it's time to start generating our reports.
Since we already created our Hybiscus resource, we can start using it in our query section. To test that we have properly set up our resource, we are going to start with a POST action type to “build-report”.

Next, go to the Hybiscus example section and copy the long bit of source code at the bottom of the page. Head back to Retool and paste the source code into the body of your “build-report” query. Be sure to change the Body Type to “Raw”. Lastly, remove the “# change as necessary” note in the ‘config’ section of the JSON.
Click “Save and Run”. If everything has been set up correctly, the following will be returned back:
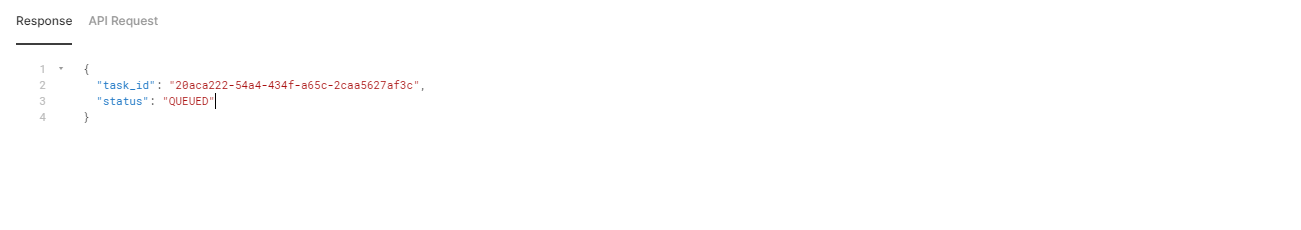
If you didn’t receive this message (note the task_id will change) you might want to head back up to the earlier sections and make sure that you’ve done each step properly.
If you did receive it, congrats! You’ve created your first Hybiscus report using Retool! Now that our report has been created. We want to pull the BASE-64 Binary of the report we just created, back into our Retool environment, to see how it looks.
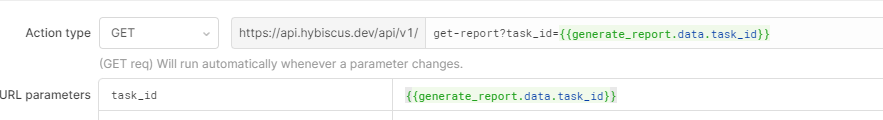
Create a new Hybiscus Resource query with the GET action type and add “get-report” to the end of your base url (as below). Then, add the URL parameter “task_id”, with the value referring to the task_id of the original ‘create-report’ query:
Click “Save and Run”.
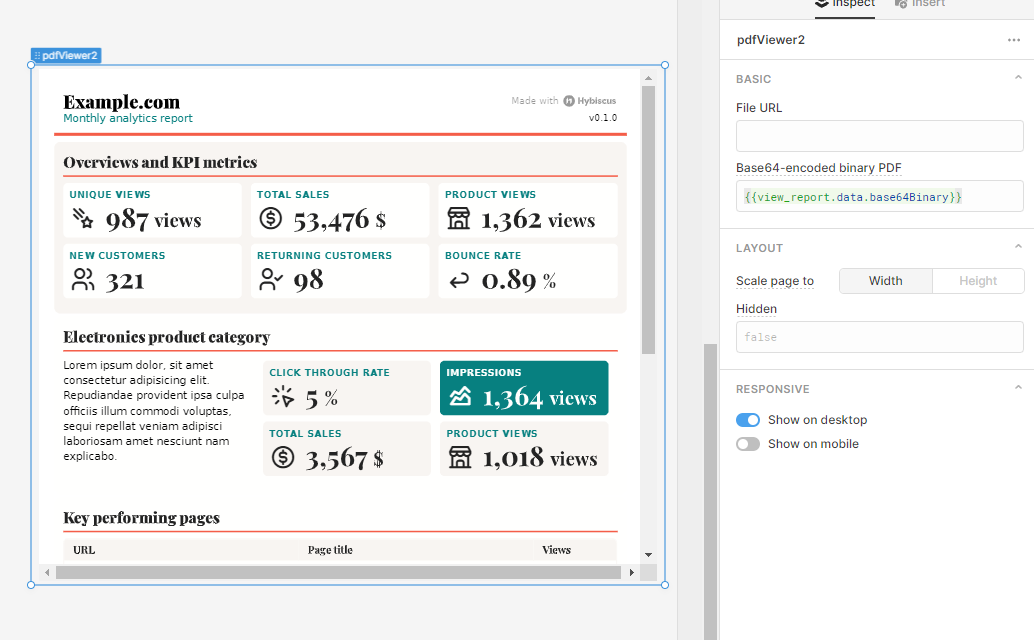
This query should then respond with the base64 Binary of the Report we just generated! Once you have that, you can pull this into a PDF Viewer component to preview the PDF, by referring to the query result in the ‘Base64-encoded binary PDF’ value box. Here is the example report generated by this query:
And with that, you now have the basis on how we will generate reports in Retool! Now that we know that our queries are working properly, we can start using some JS references and our dummy data to create some snazzy reports.
To start coding the JSON for our chart, we are going to start with the type, option and configurations for our report. You can read more about these in the Hybiscus documentation. You’ll make these changes in the JSON you copied from the Hybiscus source code, so these are all very simple customizations to make, even for non-developers.
First, you can connect your Report Title to a Retool component, such as a text input, to allow users to change this report heading. Since we already set our chart title to dynamically change according to the data displayed in the table and the filters that are applied, we can set the report_title to the name of our chart: {{example_chart.title}}.
Next you can add a byline for your report, again by connecting it to an input component, or based on a data point in your app. For the byline (or sub-heading) of my report, iI just want to show the date on which the report was generated. This needs to be in a human friendly format, so I used the moment library to provide the date ({{moment().format("MMMM,DD YYYY")}}).
Lastly, you can define the color theme and typography theme. A full list of these is available on the Hybiscus site. For mine, I used the ‘corporate’ color theme and the ‘jost’ typography. For now, the “type” will always be “Report”.
This is what my JSON looked like:
{
"type": "Report",
"options": {
"report_title": "{{example_chart.title}}",
"report_byline": "Generated {{moment().format("MMMM,DD YYYY")}}",
},
"config": {
"colour_theme": "corporate",
"typography_theme": "jost"
},
Now that you’ve defined the top level of our schema you can begin defining sections of our report using sections. Inside of each section will be that section's specific options as well as the components within it. For this report, we are going to start off with a summary section at the top of the page with details about our top performers in the table.
To do this, you need to define a section with two columns and the title such as “Top Performer”, along with the top performer’s country and category. To get our top performer, we connected the section title to the first row of our dataset and took the first two columns. This is what this looked like:
{
"type": "Section",
"options": {
"section_title": "Top Performer: {{dummy_data_filter.data['0'].country + ", " + dummy_data_filter.data['0'].item_type}}",
"highlighted": true,
"columns": 2
},
Note: in this example our ‘dummy data’ SQL filter orders our table according to total profits, this allows us to reference the query directly, (dummy_data_filter.data['0']) and still allows the end user to order the table however they’d like without affecting any of our backend. Here is our filter for reference:
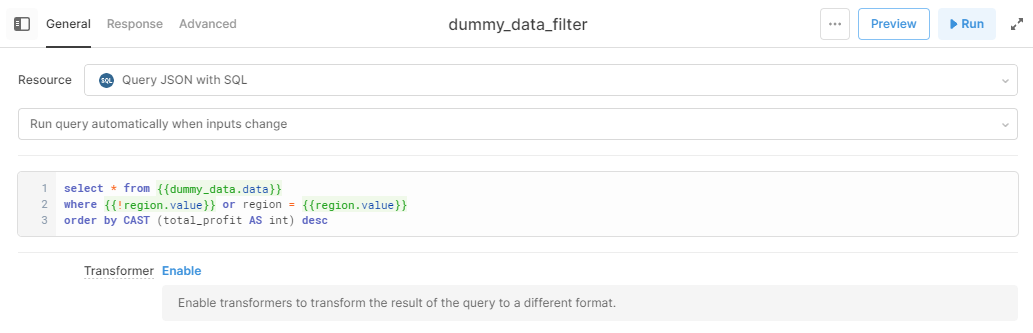
As you can see, the SQL query is ordering the total profit in descending order, so the [‘0’] in the reference above will simply pull the top value and it’s country.
Now that we’ve defined the section, we can add a couple summarizing cards about our top performer.
You could specify this value this way, or you could have the user pick this out themselves and input it into the report with an input field. There are hundreds of options to customize this report to your needs!
Here is our JSON for our cards (note the JS reference in the “value” keys). Hybiscus has additional documentation on cards (including units and icons), here:
"components": [
{
"type": "Card",
"options": {
"title": "Total Profit",
"value": {{parseFloat(dummy_data_filter.data['0'].total_profit).toLocaleString()}},
"units": "$",
"icon": "coin"
}
},
{
"type": "Card",
"options": {
"title": "Total Units Sold",
"value": "{{dummy_data_filter.data['0'].units_sold}}",
"units": "Units",
"icon": "confetti"
}
},
{
"type": "Card",
"options": {
"title": "Unit Price",
"value": "{{dummy_data_filter.data['0'].unit_price}}",
"units": "$",
"icon": "building-store"
}
}, {
"type": "Card",
"options": {
"title": "Sales Channel",
"value": "{{dummy_data_filter.data['0'].sales_channel}}",
"units": "",
"icon": "bike"
}
}
]
Lets give this query a run to see the result:
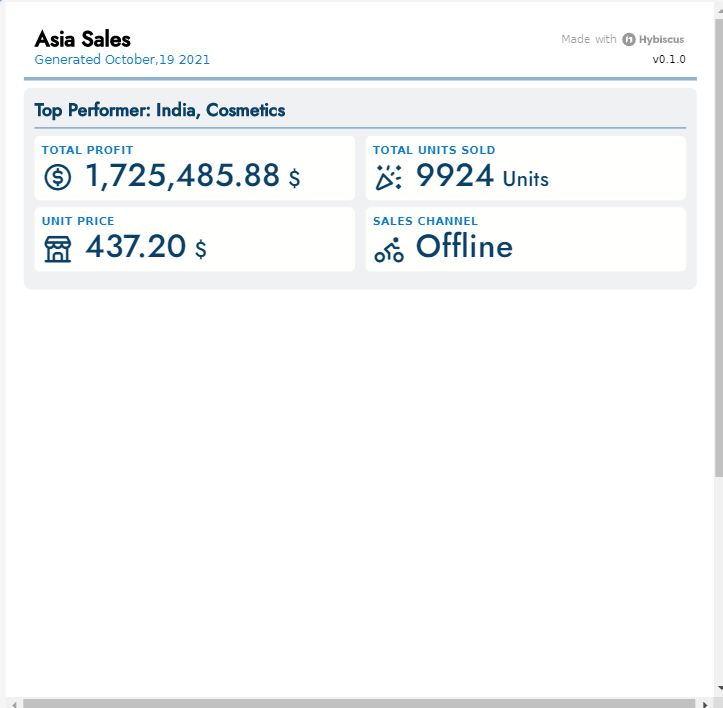
Great! Next, let’s get the top five performers into a table on our report as well as our dynamic chart. The schema to define tables using Hybiscus is a bit different to Retool’s so we will have to manipulate our data a bit.
Here, I define the columns that I would like to use and then map out the values (an array of arrays) and grab the first ten results:
{
"type": "Section",
"options": {
"section_title": "Top 5 Performers",
"icon": "dashboard",
"columns": 2,
},
"components": [
{
"type": "Table",
"options": {
"title": "Top 5 Performers",
"headings": ["Country", "Category","Units Sold","Total Profit"],
"rows": {{dummy_data_table.data.map(d=>[d.country,d.item_type,d.units_sold,parseFloat(d.total_profit).toLocaleString]).slice(0,10)}}
}}
]
This is how I have parsed this data, by mapping the attributes to create an array of each object (note I had to parse the total_profit and ‘sliced’ the first 10 items in an array):
{{dummy_data_table.data.map(d=>[d.country,d.item_type,d.units_sold,parseFloat(d.total_profit).toLocaleString]).slice(0,10)}}
Next, let’s add our chart. Again, this can be a bit finicky since the format required to make charts in Hybiscus is a bit different than what we have in Retool. I’d like to make a chart for the top 5 performers’ total profit to accompany my table:
{
"type": "BarChart",
"options": {
"data": {{ formatDataAsArray( {"x":example_chart.xAxis.slice(0,5), "y":example_chart.dataseries['3'].datasource.map(function(element){
return parseFloat(element)/10000;
}).slice(0,5)} ) }},
"x_label": "{{!region.value? "Region" : "Country"}}",
"y_label": "Total Profit (in 10 thousands)",
}
‘Data’ here accepts an array of objects, with each object having an ‘x’ and ‘y’ key, so the top 5 values of our chart component are being pulled in and mapped to arrays (using this rather complex code above). The max value for the axes is currently 500 points, so we converted the data to be presented in 10,000 increments and labelled the y-axis accordingly. The Hybiscus documentation can give you more info here.
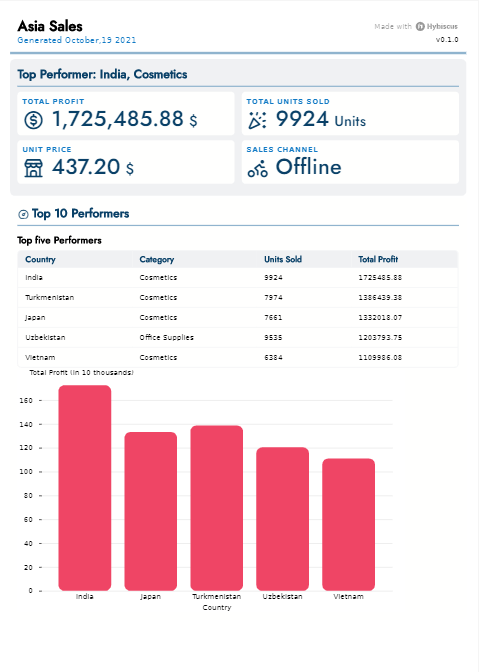
So let’s look at the result of this. The report now shows the top 5 performers; when a region is not selected, it shows regions instead of countries.
Here is our finished report:
Now that we have the queries and JSON in place to create our reports, time to hook it up in the front end. Let’s add a button, Generate Report, and a modal, View Most Recent Report:
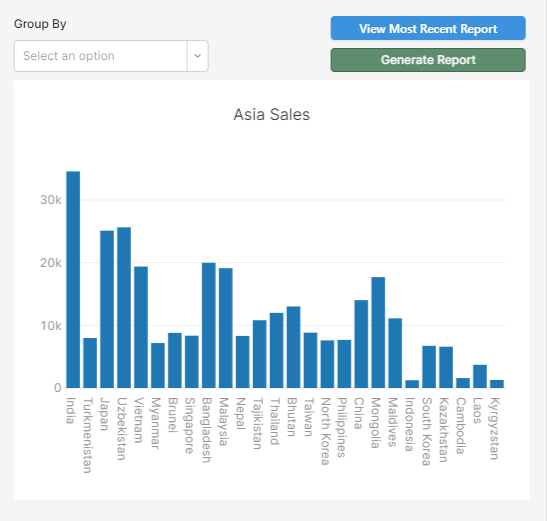
Connect your Generate Report button to your ‘generate report’ query through an event handler and then do the same for your modal to trigger the ‘view report’ (GET) query.
To preview our generated PDF, add/move your PDFviewer component into the modal. To make a download button, we will use an event handler to ‘run script’ and trigger the utils.downloadFile function that Retool provides:
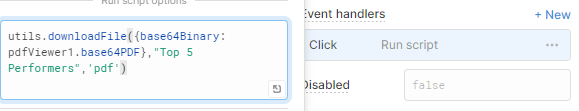
And with that final step, you should have a fully functioning data analytics app, with the ability to select data to export to a Hybiscus generated report, and preview within the app - all within a few simple clicks!

Bold Tech were the right fit for TVadSync to accelerate our use of Retool platform. We had both user experience design needs as well as back end data design needs that were quickly resolved by the team. We will be using them for all Retool app development moving forward. Highly recommended.
Joey and the team at BoldTech have been amazing partners to us from the start, helping us turn our proof of concept into paying enterprise contract in a matter of months. They feel like a natural extension of our team, and we have been incredibly impressed by their ability and willingness to dive into a complex domain and be strategic thought partners in solving nuanced workflows and complex data problems.

We build internal tools, fast.